Market Outlook October 2018

Overview

The US stock market was on an absolute tear this summer. S&P 500 went up by 7.65% and completed its best 3rd quarter since 2013. Despite the February correction, the US stocks managed to recover from the 10% drop. All major indices reached a series of record highs at the end of August and September.

Index Q1 2018 Q2 2018 Q3 2018 YTD 2018
S&P 500 Large-Cap (SPY) -1.00% 3.55% 7.65% 10.37%
S&P 600 Small-Cap (IJR) 0.57% 8.69% 4.87% 14.64%
MSCI EAFE (VEA) -0.90% -1.96% 1.23% -1.62%
Barclays US Aggregate Bond (AGG) -1.47% -0.18% -0.08% -1.73%
Gold (GLD) 1.73% -5.68% -4.96% -8.81%
Source: Morningstar


The US Economy remains strong

Markets have largely shrugged off the trade war fears benefiting from a strong economy and high corporate earnings.

US Unemployment remains low at 3.9% in July and August, levels not seen since the late 1960s and 2000.

Consumer sentiment is at a multi-year high. The University of Michigan Consumer Sentiment Index hit 100.1 in September, passing 100 for the third time since the January of 2004.

Business optimism hit another record high in August.  The National Federation of Independent Business’ small business optimism index reached the highest level in the survey’s 45-year history. According to NFIB, small business owners are planning to hire more workers, raise compensation for current employees, add inventory, and spend more on capital investments.

A hypothetical 60/40 portfolio

A hypothetical 60/40 index portfolio consisting of 30% US Large Cap Stocks, 10% US Small Cap Stocks, 20% International Stocks, 33% US Fixed Income and 7% Gold would have returned 3.06% by the end of September.

Index Allocation Return
S&P 500 30% 3.11%
S&P 600 10% 1.46%
MSCI EAFE 20% -0.32%
Barclays USAgg Bond 33% -0.57%
Gold 7% -0.62%
Hypothetical Performance 3.06%


US Equity

I expect a strong Q4 of 2018 with a record high holiday consumer and business spending. While stock valuations remain elevated, robust revenue and consumer demand will continue to drive economic growth.

After lagging large-cap stocks in 2017, small-cap stocks are having a comeback in 2018. Many domestically focused publicly traded businesses benefited massively from the recent corporate tax cuts, higher taxes on imported goods and healthy domestic demand.

This year’s rally was primarily driven by Technology, Healthcare and Consumer Discretionary stocks, up 20.8%, 16.7%, and 13.7% respectively. However, other sectors like Materials, Real Estate, Consumer Staples, Financials and Utilities are either flat or negative for the year. Keep in mind of the recent reshuffle in the sector classification where Google, Facebook, Netflix and Twitter along with the old telecommunication stocks were added to a new sector called Communication services.

Sector performance

Sector Performance Price per Price to Dividend
YTD Earnings Sales Yield
as of 10/3/2018 (TTM)  (TTM) (%)
Communication Services -1.91% 22.6x 1.3x 4.83%
Consumer Discretionary 13.72% 16.5x 1.0x 1.27%
Consumer Staples -5.50% 15.1x 1.0x 2.86%
Energy 8.67% 14.0x 1.2x 1.74%
Financials 0.29% 15.2x 2.1x 1.91%
Health Care 16.71% 18.2x 1.2x 1.86%
Industrials 4.73% 15.7x 1.1x 1.85%
Information Technology 20.86% 14.8x 2.1x 0.90%
Materials -3.56% 13.2x 1.1x 1.79%
Utilities 0.77% 17.1x 1.3x 3.70%
Source: Bloomberg


I believe that we are in the last few innings of the longest bull market. However, a wide range of sectors and companies that have largely remained on the sidelines. Some of them could potentially benefit from the continued economic growth and low tax rates.

International Equity

The performance gap between US and foreign stocks continues to grow. After a negative Q1 and Q2, foreign stocks recouped some of the losses in Q3. Furthermore, emerging market stocks are down close to -9% for the year.

Bad economic data coming from Turkey, Italy, Argentina, Brazil, Indonesia, South Africa, and China along with trade war fears put downward pressure on foreign equity markets. Additionally, rising right-wing sentiments in Italy, Austria, Sweden, Hungary, and even Germany puts doubts on the stability of the European Union and its pro-immigration policies.

In my view, the risk that the financial crisis in Turkey, Argentina, and Italy will spread to other countries is somewhat limited. However, the short-term headwinds remain, and we will continue to monitor these markets.

Brexit

Another major headline for European stocks is the progress of the Brexit negotiation. While soft Brexit would benefit both sides, a hard exit could have a higher negative impact on the UK.

I remain cautiously positive on international stocks. According to WSJ, foreign stocks are trading at a 12% discount over US equity on price to earnings basis. This year created value opportunities in several counters. However, the issue with European and Japanese stocks is not so much in valuations but the search for growth catalysts in conservative economies with an aging population.

Fixed Income

Rising Fed rates and higher inflation have driven bond prices lower so far this year. With inflation rate hovering at 2%, strong employment figures, rising commodity cost, and robust GDP growth, the Fed will continue to hike interest rates. I am expecting one more rate hike in December and three additional hikes in 2019.

I will also continue to monitor the spread between 2-year and 10-year treasury. This spread is currently at 0.23%, the lowest level since 2005.  Normally, a negative spread, i..e 2-year treasury rare higher than 10-year is a sign of a troubled economy.

While modest, individual pockets of the fixed-income market are generating positive performance this year. For instance, short duration fixed income products are now yielding in the range of 1.5% to 2%. The higher interest is now a compelling reason for many investors to keep some of their holdings in cash, CDs or short-term instruments.

With 10-year treasury closing above 3% and moving higher, fixed income investors will continue to see soft returns on their portfolio.

Gold

Gold is one of the big market losers this year. The strong dollar and robust US economy have led to the precious metal sell-off.  While the rise cryptocurrency might have reduced some of the popularity of Gold, I still believe that a small position in Gold can offer a buffer and reduce the overall long-term portfolio volatility. The investors tend to shift to Gold during times of uncertainty.

Navigating market highs

With S&P 500, NASDAQ and Dow Jones hitting all-time highs, how should investors manage their portfolio?

Rebalance

End of the year is an excellent opportunity for reconciliation and rebalancing to your target asset allocation. S&P 500 has returned 16.65% in the past five years, and the chance that equities are taking a big chunk of your portfolio is very high. Realizing some long-term gains and reinvesting your proceeds into other asset classes will ensure that your portfolio is reset to your desired risk tolerance level as well as adequately diversified.

Think long-term

In late January and early February, we experienced a market sell-offs while S&P 500 dropped more than 10%. Investors in the index who did not panic and sold at the bottom recouped their losses and ended up with 10% return as of September 30, 2018. Taking a long-term view will help you avoid the stress during market downturns and allow you to have a durable long-term strategy


If you have any questions about your existing investment portfolio or how to start investing for retirement and other financial goals, reach out to me at [email protected] or +925-448-9880.

You can also visit our Insights page where you can find helpful articles and resources on how to make better financial and investment decisions.

About the author:

Stoyan Panayotov, CFA is the founder and CEO of Babylon Wealth Management, a fee-only investment advisory firm based in Walnut Creek, CA. Babylon Wealth Management offers personalized wealth management and financial planning services to individuals and families.  To learn more visit our Private Client Services page here. Additionally, we offer Outsourced Chief Investment Officer services to professional advisors (RIAs), family offices, endowments, defined benefit plans, and other institutional clients. To find out more visit our OCIO page here.

Disclaimer: Past performance does not guarantee future performance. Nothing in this article should be construed as a solicitation or offer, or recommendation, to buy or sell any security. The content of this article is a sole opinion of the author and Babylon Wealth Management. The opinion and information provided are only valid at the time of publishing this article. Investing in these asset classes may not be appropriate for your investment portfolio. If you decide to invest in any of the instruments discussed in the posting, you have to consider your risk tolerance, investment objectives, asset allocation and overall financial situation. Different investors have different financial circumstances, and not all recommendations apply to everybody. Seek advice from your investment advisor before proceeding with any investment decisions. Various sources may provide different figures due to variations in methodology and timing,

Market Outlook April 2018

Market Outlook April 2018

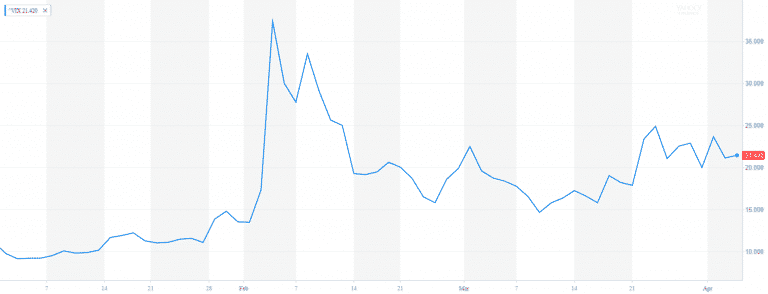
Market Outlook April 2018

After a record high 2017, the volatility has finally returned. Last year the market experienced one of the highest risk-adjusted performances in recent history. In 2017 there were only 10 trading where the S&P 500 moved by more than 1% in either direction, with not a single trading day when it moved by more than 2%. In contrast, in the 61 trading days of Q1 of 2018, we had 26 days when the S&P 500 moved by more than 1% and 8 days where it changed by more than 2%.

Learn more about our Private Wealth Management services


VIX Index Q1 2018

Market Outlook April 2018
VIX index Q1 2018. Source Yahoo Finance

The VIX Index, which measures the volatility of the S&P 500 started the year ar 9.77. It peaked at 37.33 and ended the quarter at 19.97.

Markets do not like uncertainty, and so far, Q1 had plenty of that. In the first 3 months of the year market landscape was dominated by news about rising inflation and higher interest rates, the Toys R Us bankruptcy, trade war talks and tariffs against China, and scandals related to Facebook user data privacy.

Except for Gold, all major market indices finished in the negative territory.

Index Q1 2018
S&P 500 -1.00%
Russell 2000 -0.18%
MSCI EAFE -0.90%
Barclays US Aggregate Bond Index -1.47%
Gold +1.73%


Fixed Income

Traditionally bonds have served as an anchor for equity markets. Over time stocks and US Treasury bond have shown a negative correlation. Usually, bonds would rise when stocks prices are falling as investors are moving to safer investments. However, in 2018 we observed a weakening of this relationship. There were numerous trading days when stocks and bonds were moving in the same direction.

On the other hand, despite rising interest rates, we see the lowest 10-year/2-year treasury spread since the October of 2007. The spread between the two treasury maturities was 0.47 as of March 29, 2018. While not definite, historically negative or flat spreads have preceded an economic recession.

Momentum

Momentum remained one of the most successful strategies of 2018 and reported +2.97%. Currently, this strategy is dominated by Technology, Financials, Industrials, and Consumer Cyclical stocks. Some of the big names include Microsoft, JP Morgan, Amazon, Intel, Bank of America, Boeing, CISCO, and Mastercard.

Value

Value stocks continued to disappoint and reported -3.73% return in the Q1 of 2018. Some of the biggest names in this strategy like Exxon Mobile, Wells Fargo, AT&T, Chevron, Verizon, Citigroup, Johnson & Johnson, DowDuPont and Wall-Mart fell close to or more than -10%. As many of these companies are high dividend payers, rising interest rates have decreased the interest of income-seeking investors in this segment of the market.

Small Cap

As small-cap stocks stayed on the sideline of the last year’s market rally, they were mostly unaffected by the recent market volatility.  Given that most small-cap stocks derive their revenue domestically, we expect them to benefit significantly from the lower tax rates and intensified trade war concerns.

Gold

Gold remained a solid investment choice in the Q1 of 2018. It was one of the few asset classes that reported modest gains. If the market continues to b volatile, we anticipate more upside potential for Gold.


Outlook

  • We anticipate that the market volatility will continue in the second quarter until many of the above issues get some level of clarification or resolution.
  • We expect that small and large-cap stocks with a strong domestic focus to benefit from the trade tariffs tension with China and other international partners
  • The actual impact of lower taxes on corporate earnings will be revealed in the second half of 2018 as Q3 and Q4 earnings will provide a clear picture of earnings net of accounting and tax adjustments.
  • Strong corporate earnings and revenue growth have the ability to decrease the current market volatility. However, weaker than expected earnings can have a dramatically opposite effect and drive down the already unstable markets.
  • If the Fed continues to hike their short-term lending rates and inflation rises permanently above 2%, we could see a further decline in bond prices.
  • Our strategy is to remain diversified across asset classes and focus on long-term risk-adjusted performance


If you have any questions about your existing investment portfolio or how to start investing for retirement and other financial goals, reach out to me at [email protected] or +925-448-9880.

About the author:

Stoyan Panayotov, CFA is the founder and CEO of Babylon Wealth Management, a fee-only investment advisory firm based in Walnut Creek, CA. Babylon Wealth Management offers personalized wealth management and financial planning services to individuals and families.  To learn more visit our Private Client Services page here. Additionally, we offer Outsourced Chief Investment Officer services to professional advisors (RIAs), family offices, endowments, defined benefit plans, and other institutional clients. To find out more visit our OCIO page here.


End of Summer Market Review

End of Summer Market Review

Happy Labor Day!

Our hearts are with the people of Texas! I wish them to remain strong and resilient against the catastrophic damages of Hurricane Harvey. As someone who experienced Sandy, I can emphasize with their struggles and hope for a swift recovery.


I know that this newsletter has been long past due. However, as wise people say, it is better late than never.

It has been a wild year so far. Both Main and Wall Street kept us occupied in an electrifying thriller of election meddling scandals, health reforms, political battles, tax cuts, interest rate hikes and debt ceiling fights (that one still to unfold).

Between all that, the stock market is at an all-time high. S&P 500 is up 11.7% year-to-date. Dow Jones is up 12.8%, and NASDAQ is up to the whopping 24%. GDP growth went up by 3% in the second quarter of 2017. Unemployment is at a 10-year low. 4.3%.

Moreover, despite record levels, very few Americans are feeling the joy of the market gains and feel optimistic about the future. US families are steadily sitting on the sideline and continuing to pile cash. As of June 2007, the amount of money in cash and time deposits (M2) was 70.1% of the GDP, an upward trend that has continued since the credit crisis in 2008.

End of Summer Market Review

Source: US Fed, https://fred.stlouisfed.org/graph/?g=dZn

Given that the same ratio of M2 as % of GDP is 251% in Japan, 193% in China, 91% in Germany, and 89% in the UK, US is still on the low end of the developed world. However, this is a persistent trend that can reshape the US economy for the years to come.


The Winners

This year’s rally was all about mega-cap and tech stocks. Among the biggest winners so far this year we have Apple (AAPL), up 42%, Amazon (AMZN), 27%, NVIDIA (NVDA), 54%, Adobe, 48%, PayPal, 55%. Netflix, 36%, and Visa (V), 33%,

Probably the biggest story out there is Amazon and its quest to disrupt the way Americans buy things. Despite years of fluctuating earnings, Amazon is still getting full support from its shareholders who believe in its long-term strategy. The recent acquisition of Whole Foods and announcement of price drops, only shows that Amazon is here to stay, and all the key retail players from Costco, Wall-Mart, Target, and Walgreens to Kroger’s, Home Depot, Blue Apron and AutoZone will have to adjust to the new reality and learn how to compete with Amazon.

The Laggards

Costco, Walgreens, and Target are bleeding from the Amazon effect as they reported- 0.49%, -0.74% and -21% year-to-date respectively. Their investors are become increasingly unresponsive to earnings surprises and massively punishing to earnings disappointments.

Starbucks, -0.74%, is still reviving itself after the departure of its long-time CEO, Howard Shultz, and will have to discover new revenue channels and jump-start its growth.

The energy giants, Chevron, -5%, Exxon, -12%, and Occidental Petroleum, -14.5% are still suffering from the low oil prices. With OPEC maintaining current production levels and surge in renewable energy, there is no light at the end of the tunnel. If these low levels continue, I will expect to see a wave of mergers and acquisitions in the sector. Those with a higher risk and yield appetite may want to look at some of the companies as they are paying a juicy dividend – Chevron, 4%, Exxon, 4%, and Occidental Petroleum, 5.4%

AT&T, -7% and Verizon, -5%, are coming out of big acquisitions, which down-the-road can potentially create new revenue channels and diversify away from the otherwise slow growing telecom business. In the near-term, they will continue to struggle in their effort to impress their investors. Currently, both companies are paying above average dividends, 5.15%, and 4.76%, respectively.

And finally, Wells Fargo, -4%. The bank is suffering from the account opening scandals last year and the departure of its CEO.  The stock has lagged its peers, which reported on average, 8% gains this year. While the long-term outlook remains positive, the short-term prospect remains uncertain.


Small Caps

Small Cap stocks as an asset class have not participated in this year’s market rally. Despite spectacular 2016 returns, small cap stocks have remained in the shadow of the uncertainty of the expected tax cuts and infrastructure program expansion. While I believe the Congress will come out with some tax reductions in the near term, the exact magnitude is still unclear. My long-term view of US small caps remains bullish with some near-term headwinds.


International Stocks

After several years of lagging behind US equity markets, international stocks are finally starting to catch up. The Eurozone reported 2% growth in GDP. MSCI EAFE is up 17.5% YTD, and MSCI Emerging Markets is up 28% YTD.

Despite the recent growth, International Developed and Emerging Market stocks remain cheap on a relative basis compared to US Stocks.  I maintain a long-term bullish view on international and EM stocks with some caution in the short-term.

Even though European Central Bank has kept the interest rates unchanged, I believe that its quantitative easing program will slow down towards the end of 2017 and beginning of 2018. The German bund rates will gradually rise above the negative levels. The EUR / USD will breach and remain above 1.20, a level not seen since 2014.

Interest Rates

I am expecting maximum one or may be even zero additional rate hikes this year. Under Janet Yellen, the Fed will continue to make extremely cautious and well-measured steps in raising short term rates and slowing down of its Quantitative Easing program. Bear in mind that the Fed has not achieved its 2% inflation target and any sharp rate hikes can ruin the already fragile balance in the fixed income space.

Real Estate

After eight years of undisrupted growth, US Real Estate has finally shown some signs of slow down. While demand for Real Estate in the primary markets like California and New York is still high, I expect to see some cooling off and normalization of year-over-year price growth

US REITs have reported 3.5% total return year-to-date, which is roughly the equivalent of -0.5% in price return and 4% in dividend yield.

Some retail REITs will continue to struggle in the near-term due to store closures and pressure from online retailers. I encourage investors to maintain a diversified REIT portfolio with a focus on strong management, sustainability of dividends and long-term growth prospects.

Gold

After several years of underperformance, Gold is making a quiet comeback. Gold was up 8% in 2016 and 14% year-to-date. Increasing market and political uncertainty and fear of inflation are driving many investors to safe havens such as gold. Traditionally, as an asset class, Gold has a minimal correlation to equities and fixed income. As such, I support a 1% to 5% exposure to Gold in a broadly diversified portfolio as a way to reduce long-term risk.


About the author: Stoyan Panayotov, CFA is a fee-only investment advisor based in Walnut Creek, CA. His firm Babylon Wealth Management offers fiduciary investment management and financial planning services to individuals and families.


Disclaimer: Past performance does not guarantee future performance. Nothing in this article should be construed as a solicitation or offer, or recommendation, to buy or sell any security. The content of this article is a sole opinion of the author and Babylon Wealth Management. The opinion and information provided are only valid at the time of publishing this article. Investing in these asset classes may not be appropriate for your investment portfolio. If you decide to invest in any of the instruments discussed in the posting, you have to consider your risk tolerance, investment objectives, asset allocation and overall financial situation. Different investors have different financial circumstances, and not all recommendations apply to everybody. Seek advice from your investment advisor before proceeding with any investment decisions. Various sources may provide different figures due to variations in methodology and timing,


6 Essential steps to diversify your portfolio

6 Essential steps to diversify your portfolio

Diversification is often considered the only free lunch in investing. In one of my earlier blog posts, I talked about the practical benefits of diversification. I explained the concept of investing in uncorrelated asset classes and how it reduces the overall risk of the investments.  In this article, I will walk you through 6 essential steps to diversify your portfolio.

1. Know your risk tolerance

Risk tolerance is a measure of your emotional appetite to take on risk. It is the ability to endure volatility in the marketplace without making any emotional and spur of the moment investment decisions. Individual risk tolerance is often influenced by factors like age, investment experience, and various life circumstances.

Undoubtedly, your risk tolerance can change over time. Certain life events can affect your ability to bear market volatility. You should promptly reflect these changes in your portfolio risk profile as they happen.

2. Understand your risk capacity

Often your willingness and actual capacity to take on risk can be in conflict with each other. You may want to take more risk than you can afford. And inversely, you could be away too conservative while you need to be a bit more aggressive.

Factors like the size of savings and investment assets, investment horizon, and financial goals will determine the individual risk capacity.

3. Set a target asset allocation

Achieving the right balance between your financial goals and risk tolerance will determine the target investment mix of your portfolio. Typically, investors with higher risk tolerance will invest in assets with a higher risk-return profile.

These asset classes often include small-cap, deep value, and emerging market stocks, high-yield bonds, REITs, commodities and various hedge fund and private equity strategies. Investors will lower risk tolerance will look for safer investments like government and corporate bonds, dividends and low volatility stocks.

In order to achieve the highest benefit from diversification, investors must allocate a portion of their portfolio to uncorrelated asset classes. These investments have a historical low dependence on each other’s returns.

The US Large Cap stocks and US Treasury Bonds are the classic examples of uncorrelated assets. Historically, they have a negative correlation of -0.21. Therefore, the pairs tend to move in opposite direction over time. US Treasuries are considered a safe haven during bear markets, while large cap stocks are the investors’ favorite during strong bull markets.

See the table below for correlation examples between various asset classes.

Asset Correlation Chart
Source: Portfoliovisualizer.com

4. Reduce your concentrated positions

There is a high chance that you already have an established investment portfolio, either in an employer-sponsored retirement plan, self-directed IRA or a brokerage account.

If you own a security that represents more than 5% of your entire portfolio, then you have a concentrated position. Regularly, individuals and families may acquire these positions through employer 401k plan matching, stock awards, stock options, inheritance, gifts or just personal investing.

The risk of having a concentrated position is that it can drag your portfolio down significantly if the investment has a bad year or the company has a broken business model. Consequently, you can lose a substantial portion of your investments and retirement savings.

Managing concentrated positions can be complicated. Often, they have restrictions on insider trading. And other times, they sit on significant capital gains that can trigger large tax dues to IRS if sold.

5. Rebalance regularly

Portfolio rebalancing is the process of bringing your portfolio back to the original target allocation. As your investments grow at a different rate, they will start to deviate from their original target allocation. This is very normal. Sometimes certain investments can have a long run until they become significantly overweight in your portfolio. Other times an asset class might have a bad year, lose a lot of its value and become underweight.

Adjusting to your target mix will ensure that your portfolio fits your risk tolerance, investment horizon, and financial goals. Not adjusting it may lead to increasing the overall investment risk and exposure to certain asset classes.

6. Focus on your long-term goals

When managing a client portfolio, I apply a balanced, disciplined, long-term approach that focuses on the client’s long-term financial goals.

Sometimes we all get tempted to invest in the newest “hot” stock or the “best” investment strategy ignoring the fact that they may not fit with our financial goals and risk tolerance.

If you are about to retire, you probably don’t want to put all your investments in a new biotech company or tech startup. While these stocks offer great potential returns, they come with an extra level of volatility that your portfolio may not bear. And so regularly, taking a risk outside of your comfort zone is a recipe for disaster. Even if you are right the first time, there is no guarantee you will be right the second time.

Keeping your portfolio well diversified will let you endure through turbulent times and help your investments grow over time by reducing the overall risk of your investments.

About the author: Stoyan Panayotov, CFA is a fee-only financial advisor based in Walnut Creek, CA. His firm Babylon Wealth Management offers fiduciary investment management and financial planning services to individuals and families.


Disclaimer: Past performance does not guarantee future performance. Nothing in this article should be construed as a solicitation or offer, or recommendation, to buy or sell any security. The content of this article is a sole opinion of the author and Babylon Wealth Management. The opinion and information provided are only valid at the time of publishing this article. Investing in these asset classes may not be appropriate for your investment portfolio. If you decide to invest in any of the instruments discussed in the posting, you have to consider your risk tolerance, investment objectives, asset allocation and overall financial situation. Different investors have different financial circumstances, and not all recommendations apply to everybody. Seek advice from your investment advisor before proceeding with any investment decisions. Various sources may provide different figures due to variations in methodology and timing, Copyright: www.123rf.com

Top 5 Strategies to Protect Your Portfolio from Inflation

Top 5 Strategies to Protect Your Portfolio from Inflation

Protecting Your Portfolio from Inflation

The 2016 election revived the hopes of some market participants for higher interest rates and higher inflation. Indeed, the 10-year Treasury rate went from 1.45% in July to 2.5% in December before settling at around 2.35-2.40% at the end of February 2017. Simultaneously, the Consumer Price Index, which is one of the leading inflation indicators, hit a five-year high level at 2.5% in January 2017. As many investors are becoming more concerned, we will discuss our top 5 strategies to protect your portfolio from inflation.

Higher interest and inflation rates can hurt the ability of fixed-income investors to finance their retirement. Bonds and other fixed-income instruments lose value when interest rates go up and gain value when interest rates come down.

There were numerous articles in popular media about the “great rotation” and how investors will switch from fixed to equity investments in the search for a higher return. None of that has happened yet, and the related news has seemed to disappear.

However, the prospects for higher inflation are still present. So, in this article, I would like to discuss several asset classes that are popular among individual investors. I will explain see how they perform in the environment of rising inflation.

Cash

Cash is by far one of the worst vehicles to offer protection against inflation. Money automatically loses purchasing power with the rise of inflation. Roughly speaking, if this year’s inflation is 3%, $100 worth of goods and services will be worth $103 in a year from now. Therefore, someone who kept cash in the checking account or at home will need extra $3 to buy the same goods and services he could buy for $100 a year ago.

A better way to protect from inflation, while not ideal, is using saving accounts and CDs. Some online banks and credit unions offer rates above 1%. This rate is still less than the CPI but at least preserves some of the purchasing power.

Equities

Stocks are often considered protection tools against inflation. They offer a tangible claim over company’s assets, which will rise in value with inflation. However, historical data has shown that equities perform better only when inflation rates are around 2-3%. To understand this relationship, we have to look at both Real and Nominal Inflation-Adjusted Returns. As you can see from the chart below, both real and nominal stock returns have suffered during periods of inflation that is over 5% annually. Moreover, stocks performed very well in real and nominal terms when inflation rates were between 0% and 3%.

High inflation deteriorates firms’ earnings by increasing the cost of goods and services, labor and overhead expenses. Elevated levels of inflation have the function to suppress demand as consumers are adjusting to the new price levels.

While it might look tempting to think that certain sectors can cope with inflation better than others, the success rate will come down to the individual companies’ business model. As such, firms with strong price power and inelastic product demand can pass the higher cost to their customers. Additionally, companies with strong balance sheets, low debt, high-profit margins, and steady cash flows tend to perform better in a high inflation environment.

Real estate

Real Estate very often comes up as a popular inflation protection vehicle. However, historical data and research performed the Nobel laureate Robert Shiller show otherwise.

According to Shiller “Housing traditionally is not viewed as a great investment. It takes maintenance, it depreciates, it goes out of style. All of those are problems. And there’s technical progress in housing. So, the new ones are better….So, why was it considered an investment? That was a fad. That was an idea that took hold in the early 2000s. And I don’t expect it to come back. Not with the same force. So people might just decide, ‘yeah, I’ll diversify my portfolio. I’ll live in a rental.’ That is a very sensible thing for many people to do”.

Shiller continues “…From 1890 to 1990 the appreciation in US housing was just about zero.  That amazes people, but it shouldn’t be so amazing because the cost of construction and labor has been going down.”  Rising inflation will lead to higher overhead and maintenance costs, potential renter delinquency, and high vacancy rates.

To continue Shiller’s argument, investors seeking an inflation protection with Real Estate must consider their liquidity needs. Real Estate is not a liquid asset class. It takes a longer time to sell it. “Every transaction involves paying fees to banks, lawyers, and real estate agents. There are also maintenance costs and property taxes. The price of a single house also can be quite volatile.”  Just ask the people who bought their homes in 2007, just before the housing bubble.

Commodities

Commodities and particularly gold tend to provide some short-term protection against inflation. However, this is a very volatile asset class. Gold’s volatility measured by its 42-year standard deviation is 33% higher than that of stocks and 3.5 times greater than the volatility of the 10-year treasury.  Short-term inflation protection benefits are often overshadowed by other market-related events and speculative trading.

Not to mention the fact that gold and other commodities are not easily available to retail investors outside the form of ETFs, ETNs, and futures. Buying actual commodities can incur significant transaction and storage cost which makes it almost prohibitive for individuals to physically own them.

Bonds

According to many industry “experts” bonds are a terrible tool to protect for inflation. The last several years after the great recession were very good to bonds since rates gradually went down and the 10-year treasury rate reached 1.47% in July 2017.  The low rates were supported by quantitative easing at home and abroad and higher demand from foreign entities due to near zero or negative rates in several developed economies. As the rates went up in the second half of 2016, bonds, bonds ETFs and mutual funds lost value. While bonds may have some short-term volatility with rising inflation, they have shown a strong long-term resilience. The 42-year annualized return of the 10-year Treasury is 7.21% versus 10.11% for large Cap Stocks. The Inflation adjusted rate of return narrows the gap between two asset groups, 3.07% for bonds and 5.85% for stocks.

For bond investors seeking inflation protection, there are several tools available in the arsenal. As seen in the first chart, corporate bonds due to their stronger correlation to the equities market have reported much higher real returns compared to treasuries. Moving to short-term duration bonds, inflation-protected bonds (TIPS), floating-rate bonds, are banks loan are some of the other sub-classes to consider