Tag Equities
Market Outlook October 2019
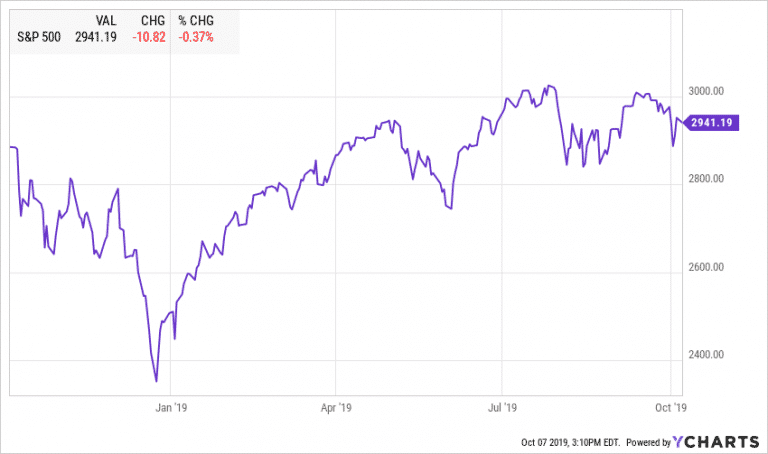
Highlights: Economic Overview Equities US Equities had a volatile summer. Most indices are trading close to or below early July levels and only helped by dividends to reach a positive quarterly return. On July 27, 2019, S&P 500 closed at…
Market Outlook July 2019
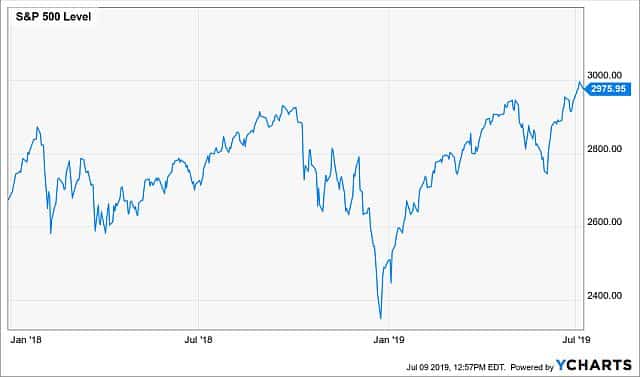
Breaking records So far 2019 has been the year of breaking records. We are officially in the longest economic expansion, which started in June of 2009. After the steep market selloff in December, the major US indices have recovered their…
Market Outlook April 2019
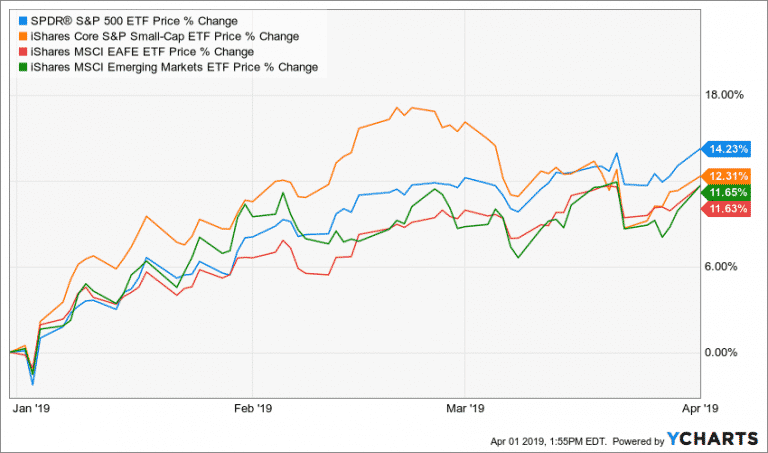
In my last commentary in early January, right after the December vortex, I gave 30% chance that the bull market will recover and 50% chance that we will see more volatility in the upcoming six months. My view of the…
Contact Us