The recent market volatility – the tale of the perfect storm

The recent market volatility – the tale of the perfect storm

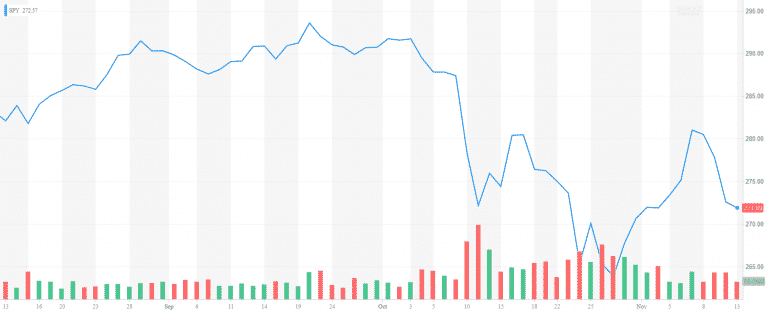
The recent market volatility – the tale of the perfect storm

October is traditionally a rough month for stocks. And October 2018 proved it.

S&P 500 went down -6.9% in October after gaining as much as 10.37% in the first nine months of the year. Despite recouping some of its losses in early November, the market continues to be volatile, with large daily swings in both directions. On top of that, Small Cap stocks, which were leading the way till late September, went down almost 10% in the span of a few weeks.

So, what led to this rout?

The market outlook in September was very positive. Consumer sentiment and business optimism were at a record high. Unemployment hit a record low. And the market didn’t really worry about tariffs.

I compiled a list of factors that had a meaningful impact on the recent market volatility. As the headline suggested, I don’t believe there was a single catalyst that drove the market down but a sequence of events creating a perfect storm for the equities to go down.

Index Q1 2018 Q2 2018 Q3 2018 Q3 YTD 2018 Oct – Nov 2018 Nov 2018 YTD
S&P 500 Large-Cap (SPY) -1.00% 3.55% 7.65% 10.37% -4.91% 5.45%
S&P 600 Small-Cap (IJR) 0.57% 8.69% 4.87% 14.64% -9.54% 5.09%
MSCI EAFE (VEA) -0.90% -1.96% 1.23% -1.62% -7.06% -8.68%
Barclays US Aggregate Bond (AGG) -1.47% -0.18% -0.08% -1.73% -0.81% -2.54%
Gold (GLD) 1.73% -5.68% -4.96% -8.81% 1.39% -7.42%
Source: Morningstar

1. Share buybacks

The month of October is earnings season. Companies are not allowed to buy back shares as they announce their earnings. The rationale is that they possess significant insider information that could influence the market in each direction. As it turned out, 2018 was a big year for share buybacks. Earlier in the year, S&P estimated $1 trillion worth of share buybacks to be returned to shareholders. So, in October, the market lost a big buyer – the companies who were buying their own shares. And no one stepped in to take their place.

The explosion of share buyback was prompted by the TCJA law last year which lowered the tax rate of US companies from 35% to 21%. Additionally, the new law imposed a one-time tax on pre-2018 profits of foreign affiliates at rates of 15.5% for cash and 8% for non-cash assets. Within a few months, many US mega-cap corporations brought billions of cash from overseas and became buyers of their stock.

2. High valuations

With the bull market is going on its ninth year, equity valuations remain high even after the October market selloff.

Currently, the S&P 500 is trading at 22.2, above the average level of 15.7. Its dividend yield is 1.9%, well below the historical average of 4.34%.

Furthermore, the current Shiller PE Ratio stands at 30.73, one of the highest levels in history. While the traditional Price to Earnings ratio is calculated based on current or estimated earning levels, the Schiller ratio calculates average inflation-adjusted earnings from the previous ten years. The ratio is also known as the Cyclically Adjusted PE Ratio (CAPE Ratio) or PE10.

While a coordinated global growth and low-interest rate environment had previously supported the thesis that high valuation ratios were justified, this may not be the case for much longer.

3. The divergence between US and international stocks

The performance of International Developed and Emerging Market remains disappointing. While the US markets are still in positive territory, International Developed and EM stocks have plunged by -8% and -15% respectively so far in 2018.  Higher tariffs imposed by the US, negative Brexit news, growing domestic debt in China, and slower GDP growth in both the Eurozone and China have spurred fears of an upcoming recession. Despite attractive valuations, international markets remain in correction territory, The dividend yield of MSCI EAFE is 3.34%, while MSCI EM is paying 2.5%, both higher than 1.9% for S&P 500.

4. The gap between growth and value stocks

The performance gap between growth and value stocks is still huge. Growths stocks like Apple, Amazon, Google, Visa, MasterCard, UnitedHealth, Boeing, Nvidia, Adobe, Salesforce, and Netflix have delivered 10% return so far this year. At the same time value strategies dominated by Financials, Consumer Staples and Energy companies are barely breaking even.

Index Q1 2018 Q2 2018 Q3 2018 Q3 YTD 2018 Oct – Nov 2018 Nov 2018 YTD  P/E Ratio
S&P 500 Large Cap Growth (IVW) 1.81% 5.17% 9.25% 16.97% -6.95% 10.01% 29.90
S&P 500 Large Cap Value (IVE) -3.53% 1.38% 5.80% 3.26% -2.59% 0.67% 19.44


5. Tempering earnings growth

So far in Q3 2018, 90% of the companies have announced earnings. 78% of them have reported better than expected actual earnings with an average earnings growth rate of 25.2%. 61% of the companies have reported a positive sales surprise. However, 58 companies in the S&P 500 (12%) have issued negative earnings guidance for Q4 2018. And the list of stocks that tumbled due to cautious outlook keeps growing – JP Morgan, Facebook, Home Depot, Sysco, DR Horton, United Rentals, Texas Instruments, Carvana, Zillow, Shake Shack, Skyworks Solutions, Michael Kors, Oracle, GE, Cerner, Activision, etc.

Despite the high consumer optimism and growing earnings, most companies’ CFOs are taking a defensive approach. Business investment grew at a 0.8% annual rate in the third quarter, down from 8.7% in the second quarter. This was the slowest pace since the fourth quarter of 2016.

The investment bank Nomura also came out with the forecast expecting global growth to slow down. Their economists predicted that global growth in 2019 would hit 3.7% and temper to 3.5% in 2020 from 3.9% in 2018. According to Nomura, the drivers for the slowdown include waning fiscal stimulus in the U.S., tighter monetary policy from the Federal Reserve, increased supply constraints and elevated risk of a partial government shutdown.


6. Inflation is creeping up

Almost a decade since the Credit Crisis in 2008-2009, inflation has been hovering below 2%. However, in 2018, the inflation has finally made a comeback. In September 2018, monthly inflation was 2.3% down from 2.9% in July and 2.7% in August.

One winner of the higher prices is the consumer staples like Procter & Gamble, Unilever, and Kimberly-Clark. Most of these companies took advantage of higher consumer confidence and rising wages to pass the cost of higher commodity prices to their customers.

7. Higher interests are starting to bite

After years of near-zero levels, interest rates are starting to go higher. 10-year treasury rate reached 3.2%, while the 2-year rate is slowly approaching the 3% level. While savers are finally beginning to receive a decent interest on their cash, CDs and saving accounts, higher interest rates will hurt other areas of the economy.


With household debt approaching $13.4 trillion, borrowers will pay higher interest for home, auto and student loans and credit card debt. At the same time, US government debt is approaching $1.4 trillion. Soon, the US government will pay more for interest than it is spending on the military.  The total annual interest payment will hit $390 billion next year, nearly 50 percent more than in 2017, according to the Congressional Budget Office.

The higher interest rates are hurting the Financial sectors. Most big banks have enjoyed a long period of paying almost nothing on their client deposits and savings accounts. The rising interest rates though have increased the competition from smaller banks and online competitors offering attractive rates to their customers.

We are also monitoring the spread between 2 and 10-year treasury note, which is coming very close together. The scenario when two-year interest rates go above ten-year rates causes an inverted yield curve, which has often signaled an upcoming recession.

8. The housing market is slowing down

Both existing and new home sales have come down this year.  Rising interest rates, higher cost of materials, labor shortage and high real estate prices in major urban areas have led to a housing market slow down.  Existing home sales dropped 3.4% in September coming down for six months in a row this year. New building permits are down 5.5% over 2017.

Markets have taken a negative view on the housing market. As a result, most homebuilders are trading at a 52-week low.

9. Fear of trade war

Some 33% of the public companies have mentioned tariffs in their earnings announcements in Q3.  9% of them have negatively mentioned tariffs. According to the chart below, Industrials, Information Technology, Consumer Dictionary, and Materials are the leading sectors showing some level of concern about tariffs.

10. Strong dollar

Fed’s hiking of interest rates in the US has not been matched by its counterparts in the Eurozone, the UK, and Japan. The German 10-year bund now yields 0.4%, while Japanese 10-year government bond pays 0.11%. Combining the higher rates with negative Brexit talks, Italian budget crisis and trade war fears have led to a strong US dollar reaching a 17-month high versus other major currencies.

Given that 40% of S&P 500 companies’ revenue comes from foreign countries, the strong dollar is making Americans goods and services more expensive and less competitive abroad. Furthermore, US companies generating earnings in foreign currency will report lower US-dollar denominated numbers.

11. Consumer debt is at a record high

The US consumer debt is reaching 4 trillion dollars. Consumer debt includes non-mortgage debts such as credit cards, personal loans, auto loans, and student loans. Student loans are equal to $1.5 trillion while auto debt is $1.1 trillion and credit card debt is close to $1.05 trillion. Furthermore, the US housing dent also hit a record high. In June, the combined mortgage and home equity debt were equal to $9.43 trillion, according to the NY Fed.

The rising debt has been supported by low delinquencies, high property values, rising wages, and low unemployment. However, a slowdown in the economy and the increasing inflation and interest rates can hurt US consumer spending.

12. High Yield and BBB-rated debt is growing

The size of the US corporate debt market has reached $7.5 trillion. The size of the BBB rated debt now exceeds 50% of the entire investment grade market. The BBB-rated debt is just one notch above junk status. Bloomberg explains that, in 2000, when BBB bonds were a mere third of the market, net leverage (total debt minus cash and short-term investments divided by earnings before interest, taxes, depreciation, and amortization) was 1.7 times. By the end of last year, the ratio had ballooned to 2.9 times.

Further on, the bond powerhouse PIMCO commented: “This suggests a greater tolerance from the credit rating agencies for higher leverage, which in turn warrants extra caution when investing in lower-rated IG names, especially in sectors where earnings are more closely tied to the business cycle.”

13. Oil remains volatile

After reaching $74.15 per barrel in October, US crude oil tumbled to $55, a 24% drop. While lower crude prices are pushing down on inflation, they are hurting energy companies, which are already trading in value territory.

According to WSJ, the oil’s rapid decline is fueling fears for global oversupply and slowing economic growth. Furthermore, the outlook for supply and demand shifted last month as top oil producers, began ramping up output to offset the expected drop in Iranian exports. However, earlier this month Washington decided to soften its sanctions on Iran and grant waivers to some buyers of Iranian crude—driving oil prices down. Another factor pushing down on oil was the strong dollar.

14. Global political uncertainty

The Brexit negotiations, Italian budget crisis, Trump’s threats to pull out of WTO, the EU immigrant crisis, higher tariffs, new elections in Brazil, Malaysian corruption scandal and alleged Saudi Arabia killing of a journalist have kept the global markets on their toes. Foreign markets have underperformed the US since the beginning of the year with no sign of hope coming soon.

15. The US Election results

A lot has been said about the US elections results, so I will not dig in further. In the next two year, we will have a divided Congress. The Democrats will control the house, while the Republicans will control the Senate and the executive branch. The initial market reaction was positive. Most investors are predicting a gridlock with no major legislature until 2020. Furthermore, we could have intense budget negotiations and even another government shutdown. Few potential areas where parties could try to work together are infrastructure and healthcare. However, any bi-partisan efforts might be clouded by the upcoming presidential elections and Mueller investigation results.

In Conclusion

There is never a right time to get in the market, start investing and saving for retirement. While market volatility will continue to prevail the news, there is also an opportunity for diligent investors to capitalize on their long-term view and patience. For these investors, it is essential to diversify and rebalance your portfolio.

In the near term, consumer confidence in the economy remains strong. Rising wages and low unemployment will drive consumer spending. My prediction is that we will see a record high shopping season. Many of these fifteen headwinds will remain. Some will soften while others will stay in the headlines.

If you have any questions about your existing investment portfolio or how to start investing for retirement and other financial goals, reach out to me at [email protected] or +925-448-9880.

You can also visit our Insights page where you can find helpful articles and resources on how to make better financial and investment decisions.

About the author:

Stoyan Panayotov, CFA is the founder and CEO of Babylon Wealth Management, a fee-only investment advisory firm based in Walnut Creek, CA. Babylon Wealth Management offers personalized wealth management and financial planning services to individuals and families.  To learn more visit our Private Client Services page here. Additionally, we offer Outsourced Chief Investment Officer services to professional advisors (RIAs), family offices, endowments, defined benefit plans, and other institutional clients. To find out more visit our OCIO page here.

Disclaimer: Past performance does not guarantee future performance. Nothing in this article should be construed as a solicitation or offer, or recommendation, to buy or sell any security. The content of this article is a sole opinion of the author and Babylon Wealth Management. The opinion and information provided are only valid at the time of publishing this article. Investing in these asset classes may not be appropriate for your investment portfolio. If you decide to invest in any of the instruments discussed in the posting, you have to consider your risk tolerance, investment objectives, asset allocation, and overall financial situation. Different investors have different financial circumstances, and not all recommendations apply to everybody. Seek advice from your investment advisor before proceeding with any investment decisions. Various sources may provide different figures due to variations in methodology and timing,

Market Outlook October 2018

Overview

The US stock market was on an absolute tear this summer. S&P 500 went up by 7.65% and completed its best 3rd quarter since 2013. Despite the February correction, the US stocks managed to recover from the 10% drop. All major indices reached a series of record highs at the end of August and September.

Index Q1 2018 Q2 2018 Q3 2018 YTD 2018
S&P 500 Large-Cap (SPY) -1.00% 3.55% 7.65% 10.37%
S&P 600 Small-Cap (IJR) 0.57% 8.69% 4.87% 14.64%
MSCI EAFE (VEA) -0.90% -1.96% 1.23% -1.62%
Barclays US Aggregate Bond (AGG) -1.47% -0.18% -0.08% -1.73%
Gold (GLD) 1.73% -5.68% -4.96% -8.81%
Source: Morningstar


The US Economy remains strong

Markets have largely shrugged off the trade war fears benefiting from a strong economy and high corporate earnings.

US Unemployment remains low at 3.9% in July and August, levels not seen since the late 1960s and 2000.

Consumer sentiment is at a multi-year high. The University of Michigan Consumer Sentiment Index hit 100.1 in September, passing 100 for the third time since the January of 2004.

Business optimism hit another record high in August.  The National Federation of Independent Business’ small business optimism index reached the highest level in the survey’s 45-year history. According to NFIB, small business owners are planning to hire more workers, raise compensation for current employees, add inventory, and spend more on capital investments.

A hypothetical 60/40 portfolio

A hypothetical 60/40 index portfolio consisting of 30% US Large Cap Stocks, 10% US Small Cap Stocks, 20% International Stocks, 33% US Fixed Income and 7% Gold would have returned 3.06% by the end of September.

Index Allocation Return
S&P 500 30% 3.11%
S&P 600 10% 1.46%
MSCI EAFE 20% -0.32%
Barclays USAgg Bond 33% -0.57%
Gold 7% -0.62%
Hypothetical Performance 3.06%


US Equity

I expect a strong Q4 of 2018 with a record high holiday consumer and business spending. While stock valuations remain elevated, robust revenue and consumer demand will continue to drive economic growth.

After lagging large-cap stocks in 2017, small-cap stocks are having a comeback in 2018. Many domestically focused publicly traded businesses benefited massively from the recent corporate tax cuts, higher taxes on imported goods and healthy domestic demand.

This year’s rally was primarily driven by Technology, Healthcare and Consumer Discretionary stocks, up 20.8%, 16.7%, and 13.7% respectively. However, other sectors like Materials, Real Estate, Consumer Staples, Financials and Utilities are either flat or negative for the year. Keep in mind of the recent reshuffle in the sector classification where Google, Facebook, Netflix and Twitter along with the old telecommunication stocks were added to a new sector called Communication services.

Sector performance

Sector Performance Price per Price to Dividend
YTD Earnings Sales Yield
as of 10/3/2018 (TTM)  (TTM) (%)
Communication Services -1.91% 22.6x 1.3x 4.83%
Consumer Discretionary 13.72% 16.5x 1.0x 1.27%
Consumer Staples -5.50% 15.1x 1.0x 2.86%
Energy 8.67% 14.0x 1.2x 1.74%
Financials 0.29% 15.2x 2.1x 1.91%
Health Care 16.71% 18.2x 1.2x 1.86%
Industrials 4.73% 15.7x 1.1x 1.85%
Information Technology 20.86% 14.8x 2.1x 0.90%
Materials -3.56% 13.2x 1.1x 1.79%
Utilities 0.77% 17.1x 1.3x 3.70%
Source: Bloomberg


I believe that we are in the last few innings of the longest bull market. However, a wide range of sectors and companies that have largely remained on the sidelines. Some of them could potentially benefit from the continued economic growth and low tax rates.

International Equity

The performance gap between US and foreign stocks continues to grow. After a negative Q1 and Q2, foreign stocks recouped some of the losses in Q3. Furthermore, emerging market stocks are down close to -9% for the year.

Bad economic data coming from Turkey, Italy, Argentina, Brazil, Indonesia, South Africa, and China along with trade war fears put downward pressure on foreign equity markets. Additionally, rising right-wing sentiments in Italy, Austria, Sweden, Hungary, and even Germany puts doubts on the stability of the European Union and its pro-immigration policies.

In my view, the risk that the financial crisis in Turkey, Argentina, and Italy will spread to other countries is somewhat limited. However, the short-term headwinds remain, and we will continue to monitor these markets.

Brexit

Another major headline for European stocks is the progress of the Brexit negotiation. While soft Brexit would benefit both sides, a hard exit could have a higher negative impact on the UK.

I remain cautiously positive on international stocks. According to WSJ, foreign stocks are trading at a 12% discount over US equity on price to earnings basis. This year created value opportunities in several counters. However, the issue with European and Japanese stocks is not so much in valuations but the search for growth catalysts in conservative economies with an aging population.

Fixed Income

Rising Fed rates and higher inflation have driven bond prices lower so far this year. With inflation rate hovering at 2%, strong employment figures, rising commodity cost, and robust GDP growth, the Fed will continue to hike interest rates. I am expecting one more rate hike in December and three additional hikes in 2019.

I will also continue to monitor the spread between 2-year and 10-year treasury. This spread is currently at 0.23%, the lowest level since 2005.  Normally, a negative spread, i..e 2-year treasury rare higher than 10-year is a sign of a troubled economy.

While modest, individual pockets of the fixed-income market are generating positive performance this year. For instance, short duration fixed income products are now yielding in the range of 1.5% to 2%. The higher interest is now a compelling reason for many investors to keep some of their holdings in cash, CDs or short-term instruments.

With 10-year treasury closing above 3% and moving higher, fixed income investors will continue to see soft returns on their portfolio.

Gold

Gold is one of the big market losers this year. The strong dollar and robust US economy have led to the precious metal sell-off.  While the rise cryptocurrency might have reduced some of the popularity of Gold, I still believe that a small position in Gold can offer a buffer and reduce the overall long-term portfolio volatility. The investors tend to shift to Gold during times of uncertainty.

Navigating market highs

With S&P 500, NASDAQ and Dow Jones hitting all-time highs, how should investors manage their portfolio?

Rebalance

End of the year is an excellent opportunity for reconciliation and rebalancing to your target asset allocation. S&P 500 has returned 16.65% in the past five years, and the chance that equities are taking a big chunk of your portfolio is very high. Realizing some long-term gains and reinvesting your proceeds into other asset classes will ensure that your portfolio is reset to your desired risk tolerance level as well as adequately diversified.

Think long-term

In late January and early February, we experienced a market sell-offs while S&P 500 dropped more than 10%. Investors in the index who did not panic and sold at the bottom recouped their losses and ended up with 10% return as of September 30, 2018. Taking a long-term view will help you avoid the stress during market downturns and allow you to have a durable long-term strategy


If you have any questions about your existing investment portfolio or how to start investing for retirement and other financial goals, reach out to me at [email protected] or +925-448-9880.

You can also visit our Insights page where you can find helpful articles and resources on how to make better financial and investment decisions.

About the author:

Stoyan Panayotov, CFA is the founder and CEO of Babylon Wealth Management, a fee-only investment advisory firm based in Walnut Creek, CA. Babylon Wealth Management offers personalized wealth management and financial planning services to individuals and families.  To learn more visit our Private Client Services page here. Additionally, we offer Outsourced Chief Investment Officer services to professional advisors (RIAs), family offices, endowments, defined benefit plans, and other institutional clients. To find out more visit our OCIO page here.

Disclaimer: Past performance does not guarantee future performance. Nothing in this article should be construed as a solicitation or offer, or recommendation, to buy or sell any security. The content of this article is a sole opinion of the author and Babylon Wealth Management. The opinion and information provided are only valid at the time of publishing this article. Investing in these asset classes may not be appropriate for your investment portfolio. If you decide to invest in any of the instruments discussed in the posting, you have to consider your risk tolerance, investment objectives, asset allocation and overall financial situation. Different investors have different financial circumstances, and not all recommendations apply to everybody. Seek advice from your investment advisor before proceeding with any investment decisions. Various sources may provide different figures due to variations in methodology and timing,

Top 5 Strategies to Protect Your Portfolio from Inflation

Top 5 Strategies to Protect Your Portfolio from Inflation

Protecting Your Portfolio from Inflation

The 2016 election revived the hopes of some market participants for higher interest rates and higher inflation. Indeed, the 10-year Treasury rate went from 1.45% in July to 2.5% in December before settling at around 2.35-2.40% at the end of February 2017. Simultaneously, the Consumer Price Index, which is one of the leading inflation indicators, hit a five-year high level at 2.5% in January 2017. As many investors are becoming more concerned, we will discuss our top 5 strategies to protect your portfolio from inflation.

Higher interest and inflation rates can hurt the ability of fixed-income investors to finance their retirement. Bonds and other fixed-income instruments lose value when interest rates go up and gain value when interest rates come down.

There were numerous articles in popular media about the “great rotation” and how investors will switch from fixed to equity investments in the search for a higher return. None of that has happened yet, and the related news has seemed to disappear.

However, the prospects for higher inflation are still present. So, in this article, I would like to discuss several asset classes that are popular among individual investors. I will explain see how they perform in the environment of rising inflation.

Cash

Cash is by far one of the worst vehicles to offer protection against inflation. Money automatically loses purchasing power with the rise of inflation. Roughly speaking, if this year’s inflation is 3%, $100 worth of goods and services will be worth $103 in a year from now. Therefore, someone who kept cash in the checking account or at home will need extra $3 to buy the same goods and services he could buy for $100 a year ago.

A better way to protect from inflation, while not ideal, is using saving accounts and CDs. Some online banks and credit unions offer rates above 1%. This rate is still less than the CPI but at least preserves some of the purchasing power.

Equities

Stocks are often considered protection tools against inflation. They offer a tangible claim over company’s assets, which will rise in value with inflation. However, historical data has shown that equities perform better only when inflation rates are around 2-3%. To understand this relationship, we have to look at both Real and Nominal Inflation-Adjusted Returns. As you can see from the chart below, both real and nominal stock returns have suffered during periods of inflation that is over 5% annually. Moreover, stocks performed very well in real and nominal terms when inflation rates were between 0% and 3%.

High inflation deteriorates firms’ earnings by increasing the cost of goods and services, labor and overhead expenses. Elevated levels of inflation have the function to suppress demand as consumers are adjusting to the new price levels.

While it might look tempting to think that certain sectors can cope with inflation better than others, the success rate will come down to the individual companies’ business model. As such, firms with strong price power and inelastic product demand can pass the higher cost to their customers. Additionally, companies with strong balance sheets, low debt, high-profit margins, and steady cash flows tend to perform better in a high inflation environment.

Real estate

Real Estate very often comes up as a popular inflation protection vehicle. However, historical data and research performed the Nobel laureate Robert Shiller show otherwise.

According to Shiller “Housing traditionally is not viewed as a great investment. It takes maintenance, it depreciates, it goes out of style. All of those are problems. And there’s technical progress in housing. So, the new ones are better….So, why was it considered an investment? That was a fad. That was an idea that took hold in the early 2000s. And I don’t expect it to come back. Not with the same force. So people might just decide, ‘yeah, I’ll diversify my portfolio. I’ll live in a rental.’ That is a very sensible thing for many people to do”.

Shiller continues “…From 1890 to 1990 the appreciation in US housing was just about zero.  That amazes people, but it shouldn’t be so amazing because the cost of construction and labor has been going down.”  Rising inflation will lead to higher overhead and maintenance costs, potential renter delinquency, and high vacancy rates.

To continue Shiller’s argument, investors seeking an inflation protection with Real Estate must consider their liquidity needs. Real Estate is not a liquid asset class. It takes a longer time to sell it. “Every transaction involves paying fees to banks, lawyers, and real estate agents. There are also maintenance costs and property taxes. The price of a single house also can be quite volatile.”  Just ask the people who bought their homes in 2007, just before the housing bubble.

Commodities

Commodities and particularly gold tend to provide some short-term protection against inflation. However, this is a very volatile asset class. Gold’s volatility measured by its 42-year standard deviation is 33% higher than that of stocks and 3.5 times greater than the volatility of the 10-year treasury.  Short-term inflation protection benefits are often overshadowed by other market-related events and speculative trading.

Not to mention the fact that gold and other commodities are not easily available to retail investors outside the form of ETFs, ETNs, and futures. Buying actual commodities can incur significant transaction and storage cost which makes it almost prohibitive for individuals to physically own them.

Bonds

According to many industry “experts” bonds are a terrible tool to protect for inflation. The last several years after the great recession were very good to bonds since rates gradually went down and the 10-year treasury rate reached 1.47% in July 2017.  The low rates were supported by quantitative easing at home and abroad and higher demand from foreign entities due to near zero or negative rates in several developed economies. As the rates went up in the second half of 2016, bonds, bonds ETFs and mutual funds lost value. While bonds may have some short-term volatility with rising inflation, they have shown a strong long-term resilience. The 42-year annualized return of the 10-year Treasury is 7.21% versus 10.11% for large Cap Stocks. The Inflation adjusted rate of return narrows the gap between two asset groups, 3.07% for bonds and 5.85% for stocks.

For bond investors seeking inflation protection, there are several tools available in the arsenal. As seen in the first chart, corporate bonds due to their stronger correlation to the equities market have reported much higher real returns compared to treasuries. Moving to short-term duration bonds, inflation-protected bonds (TIPS), floating-rate bonds, are banks loan are some of the other sub-classes to consider