Will Small Caps continue to rally under Trump Presidency?
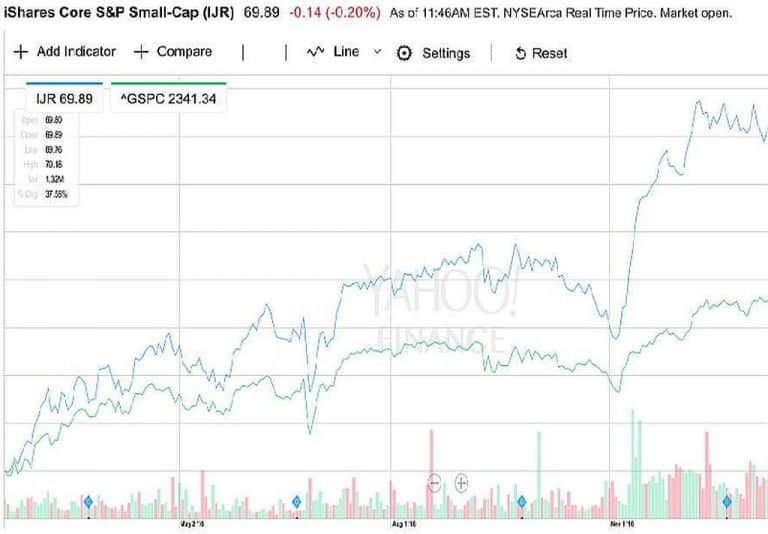
Small Cap stocks are a long-time favorite of many individual investors and portfolio manager. The asset class jumped 38% since the last election. Will Small Caps continue to rally under Trump Presidency? Can they maintain their momentum? The new president Trump…