Introduction to portfolio diversification
Introduction
Portfolio diversification is one of the main pillars of retirement planning. The old proverb “Never put all your eggs in one basket” applies in full strength to investing.
Even the Bible talks about diversification. Ecclesiastes 11:2 says “Divide your portion to seven, or even to eight, for you do not know what misfortune may occur on the earth.”
Wealth and asset managers use diversification as a tool to reduce overall portfolio risk. Diversification of investments with little correlation to one another allows the portfolio to grow at various stages of the economic cycle as the performance of the assets moves in different directions.
What is portfolio diversification?
According to the Securities and Exchange Commission (SEC): “The Magic of Diversification. The practice of spreading money among different investments to reduce risk is known as diversification. By picking the right group of investments, you may be able to limit your losses and reduce the fluctuations of investment returns without sacrificing too much potential gain.” – https://www.sec.gov/investor/pubs/assetallocation.htm
By combining low correlated and uncorrelated assets in a portfolio and being disciplined over an extended period, you aim to achieve the highest return per certain level of risk.
Diversification reduces your exposure to a single company or an asset class. As assets move up and down each year, a diversified portfolio will allow you to build a cushion for losses and avoid being dependent on one security in case it loses its value or has a rocky year.
The financial history remembers many examples of fallen stocks, such as Enron and Lehman Brothers. The employees of these companies who invested heavily in their employer’s stock without diversifying lost a significant amount of their retirement savings.
Correlated Investments
Correlated investments move in similar fashion driven by related factors. Owning two or more securities from the same industry or with similar risk profile does not contribute to your portfolio diversification. Hence, these securities will concentrate your exposure to the same market factors.
These three pairs are an example for correlated stocks – Coca-Cola and Pepsi, Target and Costco, Verizon and AT&T. While there are some differences in their business model and historical performance, the pairs are exposed to the same economic factors, industry drivers, and consumer sentiments.
Uncorrelated Investments
The combination of uncorrelated investments decreases the overall portfolio risk
The classic example of uncorrelated investments is stocks, bonds, and gold. Historically these large asset categories have moved independently from each other. Their returns were influenced by different events and economic drivers.
Even within the equity space alone, investors can significantly improve their portfolio diversification by looking at companies in various industries and exposure to regional and international markets.
The pair – Amazon and PG&E is a model for uncorrelated companies. Amazon is a global online marketplace that sells discretionary consumer items. Amazon business is dependent on the economic cycle and consumer spending sentiments. PG&E is a California-based utility company that provides electricity and gas to its customers. PG&E customers (being one of them) have a limited choice for service providers. Amazon competes with many large and small-size, local and foreign companies. PG&E has virtually no competition apart from renewable sources. Amazon has expansive market potential. PG&E growth is constrained to its local market. Therefore the difference between their core business models reflects on their historical price performance and risk profile. Their shares’ price depends on different factors and hence fluctuates independently.
Sharpe Ratio
Before we continue, I want to introduce a key performance metric in asset management called Sharpe Ratio. The ratio got its name from its creator the Nobel laureate William F. Sharpe.
The Sharpe ratio measures the excess return per unit of risk of an investment asset or a portfolio. It is also known as the risk-adjusted return.
This is the formula:

Where:
Rp is the Return of your security or portfolio.
Rf is the risk-free return of a US Treasury bond
σp is the standard deviation of your portfolio. Standard deviation measures the volatility of your portfolio returns.
The Sharpe ratio allows performance comparison between separate portfolios and asset classes with different return and risk. As a rule of thumb, the Sharp metric penalizes portfolios with higher volatility.
Take a very simplified example; portfolio ‘A’ has 5% return and standard deviation of 10%. Portfolio ‘B’ has 6% return and standard deviation of 15%. The risk-free rate is 1%
‘A’ portfolio: Sharpe Ratio is equal to (5% – 1%)/10% = 0.4
‘B’ portfolio: Sharpe Ratio is equal to (6% – 1%)/15% = 0.33
Portfolio ‘A’ has the higher Sharpe ratio and therefore the higher risk-adjusted return. Despite its lower return, it benefited from its lower volatility.
Even though ‘B’ had a higher return, it was penalized for having a higher risk.
Test 1
We will continue the explanation of the benefits of diversification with an example with real securities.
We will use two ETFs – SPY which tracks the US Large Cap S&P 500 Index and IEF, which follows the performance of the 10-year US Government bond. Let’s create three portfolios – one invested 100% in SPY, second invested 100% in IEF and third with 50%/50% split between both funds. Each portfolio starts with hypothetical $1 million. We track the performance for ten years (January 1, 2006, to December 31. 2015).
One key assumption is that at the end of each year we will rebalance the 50/50 portfolio back to the original target. We will sell off the excess amount over 50% for the overweight ETF, and we will buy enough shares from the underweight ETF so we can bring it back to 50%.
Results
| Ticker | Initial Balance | Final Balance | Average Return | Standard Deviation | Best Year | Worst Year | Max. Drawdown | Sharpe Ratio | US Market Correlation |
| IEF | $1,000,000 | $1,698,866 | 5.44% | 6.46% | 17.91% | -6.59% | -7.60% | 0.68 | -0.30 |
| 50/50 | $1,000,000 | $2,002,079 | 7.19% | 7.11% | 13.11% | -9.45% | -20.14% | 0.86 | 0.87 |
| SPY | $1,000,000 | $2,010,149 | 7.23% | 15.23% | 32.31% | -36.81% | -50.80% | 0.47 | 1.00 |
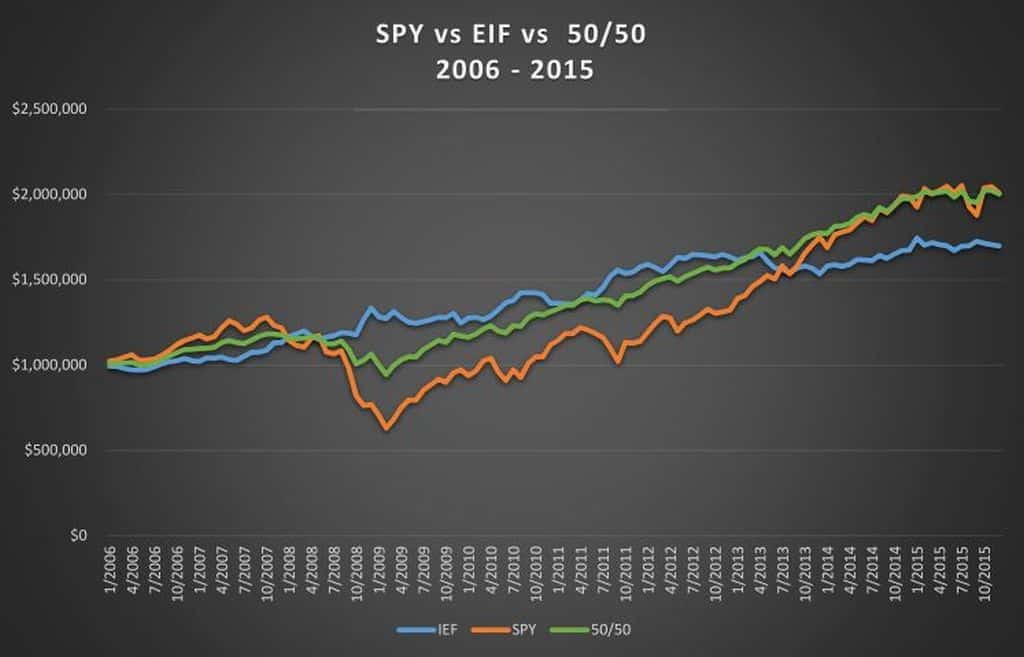
The 100% SPY portfolio has the highest return of 7.23% and best overall final balance ($2.01m). The SPY portfolio has the largest gain in a single year, 32.3% but also the biggest yearly loss of -36.8%. It also has the highest measure of risk. Its standard deviation is 15.2%. Its risk-adjusted return (Sharpe ratio) has the lowest value of 0.47.
IEF has the lowest return of the three portfolios, 5.44% but also has the “best” worst year, -6.6% and the lowest risk, 6.5%. Sharpe ratio is 0.68, higher than that of SPY.
The 50/50 portfolio has an average return of 7.19%, only 0.03% less than SPY alone. It has a standard deviation of 7.1%, only 0.65% higher than that of the 100% EIF. its market correlation is 0.87. Most importantly, the 50/50 portfolio has the highest risk-adjusted return, equal to 0.86.
The 50/50 portfolio illustrates the benefits of diversification. It provides almost the same return as the 100% large-cap portfolio with much lower risk and better returns consistency.
Test 2
In the second example, we will introduce two more portfolios.
Portfolio #4 holds 100% GLD. GLD is the largest and most liquid ETF in the gold market.
In portfolio #5, we will split SPY and IEF into 45% each and will add 10% in Gold ETF. Same rules apply. Once a year we rebalance the portfolio to the original target allocation 45/45/10.
Results
| Ticker | Initial Balance | Final Balance | Average Return | Standard Deviation | Best Year | Worst Year | Max. Drawdown | Sharpe Ratio | US Market Correlation |
| IEF | $1,000,000 | $1,698,866 | 5.44% | 6.46% | 17.91% | -6.59% | -7.60% | 0.68 | -0.30 |
| 50/50 | $1,000,000 | $2,002,079 | 7.19% | 7.11% | 13.11% | -9.45% | -20.14% | 0.86 | 0.87 |
| SPY | $1,000,000 | $2,010,149 | 7.23% | 15.23% | 32.31% | -36.81% | -50.80% | 0.47 | 1.00 |
| GLD | $1,000,000 | $1,967,041 | 7.00% | 19.20% | 30.45% | -28.33% | -42.91% | 0.39 | 0.07 |
| 45/45/10 | $1,000,000 | $2,028,238 | 7.33% | 7.05% | 13.92% | -8.01% | -16.75% | 0.88 | 0.81 |
The GLD portfolio has the highest volatility. Its standard deviation is 19.20%. It has the lowest risk-adjusted return of 0.39 and a second-lowest return of 7%.
Let’s look at our fifth portfolio – 45% SPY, 45% IEF and 10% GLD. The new portfolio has the highest return of 7.33%, the highest final balance of $2.28m, second lowest standard deviation of 7.05% and the highest risk-adjusted return of 0.88. It also has a lower correlation to the US market, 0.81.
Recap
Portfolio #5 is the clear winner of this contest. Why? We build a portfolio of uncorrelated assets, in this case, gold, 10-year Treasury, and large-cap stocks. Subsequently, we not only received an above average annual return, but we also achieved it by decreasing the risk and minimizing the volatility of our portfolio.
These hypothetical examples illustrate the benefits of diversification. Among them are portfolio risk mitigation, reduced volatility, higher risk-adjusted return, and more efficient capital preservation.
Asset correlation
So how do you determine the relationship between assets? Any financial software can provide you with this data.
If you are good at math and statistics, you can do parallel performance series for your securities and find the correlation between them.
There are a couple of free online tools, which you can use as well.
Beta
One easy way to get a sense of the correlation of your securities to the general stock market is Beta. Most financial websites like Google Finance and Yahoo Finance will give you this metric. Beta shows you the stock volatility compared to S&P 500. That said, the beta of S&P 500 is always 1. So for instance, if the beta of your stock is 2, you should expect twice as much volatility of your stock as compared to S&P 500. If the beta is 0.5, you would expect half of the volatility. If the beta is -0.5, then your stock and S&P will be negatively correlated. When one goes up, the other one will go down.
A quick search in Good Finance brought me these results for the securities we discussed earlier.
Beta for IEF is -0.20, SPY is 1, GLD is 0.07, Coca Cola, 0.51, Pepsi, 0.44, Target, 0.63, Costco, 0.55, Verizon, 0.22, AT&T, 0.29, Amazon, 1.1 and PG&E, 0.17,
Few other companies and ETFs of interest are: TLT, 20-year T-bond Index, -0.59, VNQ, REIT Index, 0.81, VYM, Vanguard High Dividend ETF, 0.81, USMV, iShares Low Volatility ETF, 0.68, Google, 1.03, Facebook, 0.76, Wal-Mart, 0.19, Starbucks, 0.80, McDonalds, 0.51. Walt Disney, 1.32, Bank of America, 1.74.
The beta of the stocks can vary depending on market conditions, economic and business cycles. I recommend using in combination with other metrics like standard deviation, R-square, and Sharpe Ratio. This approach will help you gauge the expected volatility of your stock.
How many assets should you ideally keep in your portfolio?
Some theories call for 7-10 broad asset classes. This method is ideal for smaller-size portfolios. It will help control trading and rebalancing costs.
Other theories call for 20-25 asset classes. This approach is best suitable for large-size portfolios with more complex structure.
A regular portfolio should include these three groups with their subclasses.
Equity includes Large Cap, Mid Cap, Small Cap, Micro Cap, International Developed and Emerging Markets. In addition to that, you can add growth, value, dividend, low volatility, and momentum strategies.
Fixed Income includes US Treasuries, Municipal Bonds, Investment Grade Corporate Bonds, High Yield, Preferred Stock, International, and Emerging Market Bonds
Alternative Investments include Real Estate, Precious Metals, Commodities, Infrastructure, Private Equity, Hedge Funds.
About the author: Stoyan Panayotov, CFA is a fee-only financial advisor based in Walnut Creek, CA. His firm Babylon Wealth Management offers fiduciary investment management and financial planning services to individuals and families.
Contact Us