Top 5 Dividend Growth ETFs

Dividend Growth ETFs

Dividend growth ETFs offer a convenient and diversified way to invest in companies that consistently grow their dividends. Certainly, dividend-paying stocks provide a predictable stream of cash flows to investors looking for extra income. Companies that steadily grow their dividends year over year are known as dividend aristocrats. Investors often view high dividend blue-chip companies as financially stable and less volatile than growth companies. Above all, the extra cash from dividends provides a buffer from market volatility. Many retirees use dividends to supplement their income during retirement. In the current low-interest environment, dividend growth ETFs are a compelling low-cost option for investors looking for extra yield. With a 10-year US treasury paying below 1%, income investors will need to look elsewhere for income. Furthermore, compared to mutual funds, exchange-traded funds offer an inexpensive and tax-efficient way to invest without worrying about annual capital gains distributions.

Retirement Calculator

Our top Dividend Growth ETF picks

I have prepared a list of my favorite five dividend growth ETFs. Besides their shared focus, these dividend ETFs have a different approach in constructing their underlying portfolio. Depending on your goals, each ETFs will give you a different exposure and dividend payout.

Dividend Growth ETF Performance 2010-2019

Ticker CAGR St Dev Best Year Worst Year Max. Drawdown Sharpe Ratio US Mkt Correlation
VYM 12.86% 11.16% 30.08% -5.91% -11.84% 1.09 0.95
SDY 13.07% 11.15% 30.07% -2.74% -11.00% 1.11 0.92
VIG 12.63% 11.30% 29.62% -2.08% -14.18% 1.06 0.96
DVY 12.96% 10.60% 28.85% -6.32% -10.08% 1.15 0.88
FVD 13.18% 10.21% 26.77% -3.48% -11.11% 1.21 0.91
SPY 13.44% 12.44% 32.31% -4.56% -16.23% 1.04 1.00

Source: portfoliovisualizer.com

Vanguard High Dividend Yield ETF – VYM

Vanguard High Dividend Yield ETF, VYM, tracks the FTSE High Dividend Yield Index. The index selects high-dividend-paying US companies and weights them by market cap. The underlying index excludes real estate investment trusts (REITs).

VYM ETF offers a low-cost, diversified, conservative exposure to high dividend yield large-cap stocks. Vanguard High Dividend Yield ETF charges 0.06% fee and currently pays a 3.2% dividend yield.

The ETF selects its holdings by ranking companies by their forecast dividends over the next 12 months. Only the stocks in the top half are selected. The remaining stocks are weighted by market capitalization. Due to its methodology, VYM tends to hold a large basket of large-cap value stocks.

SPDR® S&P Dividend ETF – SDY

SPDR® S&P Dividend ETF, SDY, tracks a yield-weighted index of dividend-paying companies from the S&P 1500 Composite Index. SDY uses dividend sustainability screens and only holds companies that have increased dividends for the past 20 years. The highest yielding firms are then weighted by dividend yield.

Many tech companies do not meet the strict requirements of paying dividends in the past 20 years. Therefore, SPDR® S&P Dividend ETF has minimal exposure to technology stocks.  Nevertheless, SDY is one of the few dividend growth ETFs that provides exposure to REITs.

SPDR® S&P Dividend ETF charges 0.35% fee and pays a 2.6% dividend yield. Unlike VYM, which ranks its holdings by market capitalization. SDY has a slight tilt towards mid-cap stocks. Investors looking for a broader exposure to the US dividend-paying stocks may find this ETF compelling despite its higher fee.

Vanguard Dividend Appreciation ETF – VIG

Vanguard Dividend Appreciation ETF, VIG, is the most growth-oriented ETF on our list of Dividend growth ETFs. VYM is the largest fund by assets under management (AUM). It tracks a market-cap-weighted index of US companies that have increased their annual dividends for ten or more consecutive years. VIG charges a 0.06% fee and pays a 1.8% dividend. Notably, this ETFs dividend yield is a tad smaller than the yield on the S&P 500.

VIG focuses on dividend growth rather than dividend yield. The fund selects firms that have increased their dividend payments for the past ten years and market-cap-weights its holdings. VIG has the biggest exposure to large-cap and mid-cap growth stocks. In conclusion, investors looking for exposure to high-quality dividend-paying large-cap stock may wish to consider VIG for their portfolios.

iShares Select Dividend ETF – DVY

iShares Select Dividend ETF offers the highest dividend yield on our list of Dividend growth ETF.  DVY pays 3.7% in dividends and charges 0.39% in fees. DVY tracks a dividend-weighted index of 100 US companies. The index selects dividend stocks from the Dow Jones broad market-cap index, excluding REITs.

DVY offers exposure to the US high-dividend stocks that skews towards large, mid, and small-cap value firms paying consistent dividends. DVY’s methodology has a strict sustainability screen, designed to select companies that pay steady and rising dividends. The screening process includes companies with at least $3 billion of market capitalization. Further on, the ETF selects stocks with five-year dividend growth, a coverage ratio of 167 or higher, positive trailing 12-months earnings per share, and high trading volume. The DVY portfolio has significant sector bets towards utilities and financial services.

First Trust Value Line® Dividend ETF – FVD

First Trust Value Line® Dividend ETF, FVD, aims to track an equal-weighted index of dividend-paying companies. The ETF uses a proprietary screening process that only includes companies with more than $1 billion in market cap. FVD has the highest fee on our list. It charges 0.7%, and it pays a 2.1% dividend.  FVD has the best 10-year performance and has reported a slightly lower risk of all five ETFs. Despite its higher than average performance, it produces one of the lowest yields in the group.

FVD creates its portfolio in two steps. First, it uses Value Line’s proprietary ‘safety rating’ system to select low-beta stocks from companies with strong balance sheets. Then it chooses the stocks with above-average yields and weights them equally. The methodology includes REITs and foreign ADRs. As a result, FVD has the highest exposure to international stocks in our list of Dividend growth ETFs. FVD makes big sector bets towards utilities and financial services.

Additionally, it has a slight tilt towards mid-cap stocks. Despite its higher than average performance, FVD produces one of the lowest yields in the group.  In conclusion, investors willing to accept the high cost of FVD may like to use it as an alternative to the more popular dividend growth ETFs.

Dividend Growth ETF Summary

As a group, dividend growth ETFs offer a steady income for yield-hungry investors. Even though none of them have outperformed the S&P 500 in absolute terms, most of these ETFs reported better risk-adjusted returns. In times of market turmoil and uncertainty, dividend growth ETFs offer extra income and lower volatility


Disclaimer
Past performance does not guarantee future returns. Nothing in this article should be construed as a solicitation or offer, or recommendation, to buy or sell any security. The content of this article is the sole opinion of the author and Babylon Wealth Management. The opinion and information provided are only valid at the time of publishing this article. Investing in these asset classes may not be appropriate for your investment portfolio. Before investing, you have to consider your risk tolerance, investment objectives, asset allocation, and overall financial situation. Different investors have different financial circumstances, and not all recommendations apply to everybody. Seek advice from your investment advisor before proceeding with any investment decisions. Various sources may provide different figures due to variations in methodology and timing,

The Rise of Momentum Investing

The Rise of Momentum Investing

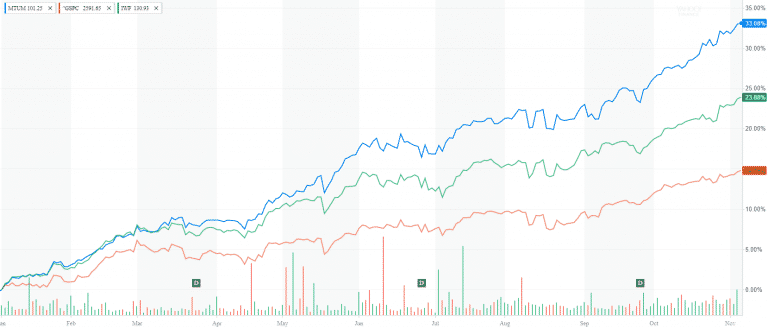
The Rise of Momentum Investing

While the momentum theory has been around for two decades, we had to wait until 2017 to see the rise of momentum investing. The largest momentum ETF (MTUM) is up 35% YTD. And unless something dramatic happens in the remaining few weeks, momentum will crush all major market-cap weighted indices and ETFs.

About this time last year, I posted my first article about momentum investing in Seeking Alpha. You can see my article here. At that time MTUM had only $1.8 billion of AUM and trailed the S&P 500 2016 returns in the range of 5% versus 12%. Eleven months later, MTUM is up 35% versus 16.5%. I can’t take any credit for calling this wide margin in performance, but it certainly grabbed the attention of investors. MTUM is currently at $4.8b AUM and possibly growing even more down the road.

Learn more about our Private Wealth Management services

What is momentum investing

So what is momentum and why do we keep hearing about it a lot more lately?

The momentum investing is a pure behavioral play. Not surprisingly the rise of momentum investing coincided with Richard Thaler’s Nobel award for his work on how human behavior and finance play out together.

Momentum investing exploits the theory that recent stock winners will continue to rise in the near-term. The strategy is based on the 1993 Journal of Finance research “Returns to Buying Winners and Selling Losers: Implications for Stock Market Efficiency” by Narasimhan Jegadeesh and Sheridan Titman

Their research discovers a pattern that buying stocks that have performed well in the past and selling stocks that have performed poorly generate significant positive returns over 3- to 12-month holding periods. Furthermore, the research discusses that the success of this strategy is due to behavioral finance factors.

Investors commonly overact on the news and therefore overbuy the winners and oversell the losers.

Many investors consider the momentum strategy as a substitute for growth investing. However, the momentum theory embraces both value and growth stocks as long as they have risen in the past 6 to 12 months.

While the momentum theory has been around for over 20 years, the strategy has not received a wide acceptance amongst investors. Despite its academic fundamentals, momentum strategy has experienced contradictory practical interpretations amongst fund managers, which has reported a massive variability of returns.

Fortunately, the growing popularity of market-cap and smart beta ETFs made the momentum strategy widely available to retail investors. Further down, I will discuss how to take advantage of the momentum theory by using MTUM – iShares Edge MSCI USA Momentum Factor ETF. This ETF has been around since April 2013. It has a dividend yield of 1.12% and an expense ratio of 0.15%.

MTUM replicates the MSCI USA Momentum Index. MSCI USA Momentum Index uses a multi-step process to filter for stocks that fit the momentum criteria. The composition process starts with selecting companies with the highest 6- and 12- month performance. The performance is later weighted by their 3-year standard deviation and given a momentum score. The final weight in the momentum index is given by multiplying the momentum score by the market capitalization weight in the parent index. In this case, the parent index is MSCI USA Index, which has 616 constituents and covers about 85% of the US market cap. Company weights for MSCI USA Momentum Index are capped at 5%. The index is rebalanced semiannually. However, spikes in market volatility can trigger ad-hoc rebalancing.


Performance and risk

MSCI USA Momentum Index has consistently outperformed MSCI USA and S&P 500 since its inception. The index has achieved a cumulative return of 531% versus 400% for MSCI USA and 423% for S&P 500 since October 2002.

In annualized terms, MSCI USA Momentum Index posted 9.07% 10-year return and 13.65% return since its inception in 1994.

The index beat its parent in 9 out of the past 15 years and underperformed in six – 2003, 2006, 2008, 2009, 2012 and 2016.

It is an interesting observation that the Momentum strategy underperformed in the years following a significant market pullback or sluggish return (02-03, 05-06, 08-09 and 11-12). It takes a two-year cycle for the Momentum Index to start outperforming again after experiencing a negative period. The composition of the index is somewhat reactive, which naturally doesn’t allow it to take advantage of market rallies in specific sectors.

MSCI USA Momentum Index Performance

Source: MSCI


Counterintuitively to what some may think, the MSCI Momentum Index has reported lower standard deviation (risk) than its parent index for the past 3-year and slightly higher standard deviation for the 5- and 10-year period. The risk-weighted methodology described earlier helps the index cap its volatility despite high turnover.

Higher returns and capped volatility has allowed the momentum index to report consistently high risk-adjusted returns. Its 10-year Sharpe ratio is 0.59 versus 0.51 for MSCI USA and 0.53 for S&P 500. Since inception, the Momentum Index posted the impressive 0.72 versus 0.54 MSCI USA and S&P 500.

MSCI USA Momentum Index Risk Adjusted Returns

Source: MSCI


MTUM ETF

Going back to the iShares Edge MSCI USA Momentum Factor ETF, it has been around since April 2013. Since inception, its performance has been consistent with the index. MTUM posted 17.3% return versus 13.4% for S&P 500 and 15.32% for IWF, Russell 1000 growth ETF.

MTUM Performance Since inception

MTUM has reported a Sharpe ratio of 1.61 vs. 1.33 for S&P 500 and 1.41 for IWF.

Few other interesting facts for investors looking to diversify. The US market correlation is equal to 0.87. Beta is 0.90. Alpha is 4.7%, and R2 is 73.7%. In other words, the momentum strategy achieved its return not only with less risk but a lot lower correlation to the total market, which is critical for portfolio diversification.

MTUM Holdings

Momentum investing is a dynamic strategy with quarterly rebalancing. Due to its 114% turnover, it is extremely cost ineffective for the average retail investor to replicate it

Currently, MTUM overweights Financials, Technology, and Industrials which have primarily driven the market since the beginning of 2017. Simultaneously, the ETF underweights Consumer Cyclical, Utilities, and Energy. Its main holdings include Microsoft, Bank of America, JP Morgan, Apple, United Health Group, NVIDIA, Home Depot, Comcast, and Boeing. Just to illustrate the dynamic nature of this strategy, a year ago its top holdings were in Technology and Utilities with leading names such as Facebook, Amazon, Google, and Nextera.


Final thoughts

  1. The momentum strategy has outperformed the broad market in the past 22 years.
  2. While being in the public eye for over two decades and posting impressive long-term absolute and risk-adjusted returns, the momentum strategy is still not a highly popular trade and has mostly been a theoretical exercise with conflicting practical results.
  3. Only lately, the rise of ETFs had made the strategy available to regular investors.
  4. The momentum strategy tends to lean towards sectors with a recent high
  5. Like any factor strategy, the momentum can underperform the broad market for extended periods


About the author: Stoyan Panayotov, CFA is the founder and CEO of Babylon Wealth Management, a fee-only investment advisory firm. Babylon Wealth Management offers highly customized Outsourced Chief Investment Officer services to professional advisors (RIAs), family offices, endowments, defined benefit plans and other institutional clients. To learn more visit our OCIO page here.

Holdings disclaimer: I own MTUM and we regularly invest MTUM for our clients

Disclaimer: Past performance does not guarantee future performance. Nothing in this article should be construed as a solicitation or offer, or recommendation, to buy or sell any security. The content of this article is a sole opinion of the author and Babylon Wealth Management. The opinion and information provided are only valid at the time of publishing this article. Investing in these asset classes may not be appropriate for your investment portfolio. If you decide to invest in any of the instruments discussed in the posting, you have to consider your risk tolerance, investment objectives, asset allocation and overall financial situation. Different investors have different financial circumstances, and not all recommendations apply to everybody. Seek advice from your investment advisor before proceeding with any investment decisions. Various sources may provide different figures due to variations in methodology and timing,


5 Myths and One True Fact about passive investing

5 Myths and One True Fact about passive investing

The passive investing in ETFs and index funds has experienced a massive influx of money in the past ten years. The US ETF market is quickly approaching $3 trillion in assets under management. As of March 29, 2017, the total AUM for US ETFs was equal to $2.78 trillion. The value is still dwarfing the $16-trillion mutual fund business. However, it is growing at a steady pace of $300-400 billion annually and slowly catching up. Inevitably, passive investing will continue to grow while active investing will shrink over time until they reach some equilibrium. A lot has been said and written in the media about the benefits of passive investing and indexing. However, I would like to point out 5 Myths and One True Fact about passive investing.

1. Passive investing is cheap

One of the main slogans of the passive investing campaign is that is cheaper than active investing i.e mutual funds. Indeed, the large US ETFs are now charging as low as 0.04% while many active managers are still asking for 1% – 1.5% in management fees.

However, some less obvious costs remain hidden and misunderstood by the average investor. ETFs have two large expense categories – transaction and holding costs.

Transaction costs include trade commissions, bid-ask spread, and market impact. Holding costs include management fees, index tracking error, and taxes.Without getting too technical, holding larger and more liquid ETFs like SPY and VTI will minimize these costs. While, trading smaller ETFs can drive higher hidden costs due to poor trade execution, higher fees, significant index tracking error, and even taxes.

2. Passive investing always beats active investing

According to a recent study by PIMCO, 46% of all active equity fund managers and 84% of all active bond managers over performed their median passive peers in the past five years. In practice, passive investing will perform very well in efficient market segments such as large cap stocks where most companies receive a good amount of publicity and research coverage. On the other hand, active managers will do better in less efficient asset classes like small-cap, emerging markets, and fixed income. These markets have a lot bigger room for mispricing and price discovery due to fragmentation of market players and lower research coverage.

3. Passive investing gives you control

Intuitively it makes sense to think that passive investing provides more control over your investment decisions. After all, you are not paying an active manager to pick and choose your stock holdings. But, and there is always but, most passive investment strategies are market cap weighted. That means whether you invest in S&P 500 (SPY) or Total Equity Market (VTI), a significant portion of your money will go to companies like Apple, Microsoft, Exxon Mobile, Amazon, Johnson and Johnson, General Electric, JP Morgan and Wells Fargo. In fact, you have no choice. The top 10 companies in S&P 500 make up 19% on the index and the remaining 490 stocks make up 81%. Indices are already set and you will follow their performance. 

4. Passive investing is less risky

Investing comes with risk.  And passive investing is as risky as any other form of investing. Passive investors are equally exposed to losses during bear markets, sudden market corrections or just following the wrong index.  In fact, many ETFs are becoming a popular tool amongst traders and hedge fund managers to park extra cash or quickly get in and out of certain positions. Sudden large inflows and selloffs can impose significant risks to smaller retail investors due to an imbalance of trading volume between ETFs and underlying securities.

I also want to point out the increasing presence of Exchange Traded Notes, leveraged, inverse, commodity and volatility ETFs. They carry significant risk to investors and should not be used for long-term retirement planning.

In contrast to that, many active managers use risk-adjusted measures like Sharpe ratio, information ratio, Treynor Ratio and Alpha when assessing their performance to their respective benchmark. Furthermore, many iconic active mutual funds lost a lot less than similar ETFs during the last bear market in 2008-2009 mainly because of their strong risk management policies.

5. Passive investing is efficient

ETFs trade daily and have intra-day pricing like any other stock on the exchange. Naturally, ETFs were designed as a vehicle to provide liquidity and transparency in the marketplace.

However, there have been numerous occasions of significant ETF market mispricing, On August 24, 2015, due to a flash sale, several ETFs lost more than 40% – 50% of their value in a matter of seconds before they recover.

More recently, on March 20, a computer glitch on the largest ETF Exchange, NYSE Arca, caused significant delays and mispricing of thousands of ETFs.

6. The act of choosing passive investing is, in fact, active investing

While the “passive” in the name implies a lack of involvement in the investment decision making, in reality, there is no true passive investing. Passive investing is a type of active investment management. Choosing between passive and active funds is an active choice. Selecting which index to follow is an active decision. Allocating between different asset classes is an act of investment election. Even, the process of deciding when to buy and when to sell an index fund or an ETF is an active decision.

About the author: Stoyan Panayotov, CFA is a fee-only financial advisor based in Walnut Creek, CA. His firm Babylon Wealth Management offers fiduciary investment management and financial planning services to individuals and families.

Disclaimer: Past performance does not guarantee future performance. Nothing in this article should be construed as a solicitation or offer, or recommendation, to buy or sell any security. The content of this article is a sole opinion of the author and Babylon Wealth Management. The opinion and information provided are only valid at the time of publishing this article. Investing in these asset classes may not be appropriate for your investment portfolio. If you decide to invest in any of the instruments discussed in the posting, you have to consider your risk tolerance, investment objectives, asset allocation and overall financial situation. Different investors have different financial circumstances, and not all recommendations apply to everybody. Seek advice from your investment advisor before proceeding with any investment decisions. Various sources may provide different figures due to variations in methodology and timing, Copyright: <a href=’https://www.123rf.com/profile_vadymvdrobot’>vadymvdrobot / 123RF Stock Photo</a>

MLP Investing – Risks and benefits

MLP Investing

MLP investing is popular among retirees and income-seeking investors.  In this article, we will break down the benefits, risks and tax implications of investing in MLPs.

What is an MLP?

Managed Limited Partnerships (MLPs) have grown in popularity in the past several years. Many U.S. energy firms have reorganized their slow-growing, but stable cash flow businesses, such as pipelines and storage terminals, into MLPs.

MLPs are very attractive to income-seeking investors. They must pass at least 90% of their income to their partners (investors). As a whole, the MLP sector offers on average 6% annual yield with some MLPs reaching over 15%.

Companies that operate as MLPs tend to be in very stable, slow-growing industries, such as pipelines and energy storage. The nature of their business offers few opportunities for price appreciation. On the other hand, cash distributions are relatively stable and predictable giving the MLPs features of both an equity and fixed income investment.

The number of public MLPs increased dramatically in the past 20 years. There were more than 18 IPOs in 2014 from almost zero in 1984.      

MLP Legal structure

There are two types of MLP owners – general and limited partners. General partners manage the day-to-day operations of the partnership. All other investors are limited partners and have no involvement in the company’s activities. MLPs technically have no employees.

MLP investors buy units of the partnership. Unlike shareholders of a corporation, they are known as “unitholders.”

Each unitholder is responsible for paying their share of the partnership’s income taxes. Unitholders are required to file K-1 forms in each state where the MLP operates, regardless of the size of revenue generated from that state. This filing requirement makes the direct MLP ownership.

Additionally, open-end funds like traditional ETFs are restricted from investing more than 25% of their portfolio in MLPs. Therefore most ETFs choose a C-corporation or ETN structure in order to track the MLP market.

Distributions

MLPs provide generous income to their investors. The average yield is around 6% as some small MLPs pay up to 15%. The distributions from MLP consist of non-qualified dividends, return on capital, and capital gains.

Since MLPs pass through 90% of their income to unitholders, each type of distribution has different tax treatment.

Dividends are taxed at the ordinary income tax level, up to 39.6% plus 3.8% for Medicare surcharge.

Capital gains are taxable as either long-term or short-term. Long-term capital gains have favorable tax treatment with rates between 0, 15% and 20%. Short-term gains are taxed at the ordinary income level.

The largest portion of MLP distributions comes as a return on capital. The benefit comes from the MLPs use of depreciation allowances on capital equipment, pipelines, and storage tanks, to offset net income. Return on capital distributions are tax deferred. Instead of being immediately taxable, distributions decrease the cost basis of the investment. Taxes are only due to these distributions when investors sell their units. In fact, investors can defer paying taxes indefinitely by keeping their shares.

Tax Impact

MLP distributions are not sheltered from taxes in retirement accounts. According to the Unrelated business taxable income (UBTI) rule, unitholders will owe taxes on partnership income over $1,000 even if the units are held in a retirement account.

Individual MLP holdings, ETFs, mutual funds and CEFs are most suitable for long-term buy and hold investors in their taxable investment accounts. Those investors can benefit from the tax-deferred nature of the cost of capital distributions, which will decrease their cost basis over time. They will pay taxes only when they sell their units. Investors can avoid paying taxes indefinitely or until cost basis reaches zero. In that case, they will owe taxes on the return of capital distributions at the long-term capital gain rate.

Short-term investors may consider ETNs for their better index tracking. All distributions from ETNs are taxable as an ordinary income level and do not provide any preferential tax treatment.

Risk considerations with MLP Investing

MLPs drive their revenue from the volume of transported energy products. Their business is less dependent on the fluctuations of the commodity prices compared to other oil & gas companies. Historically, MLPs as a group is less volatile than the broader energy sector. MLP price tends to have a direct correlation with the partnership distributions. Higher payouts drive higher prices while lowers distributions push the price down.

Between September 2010 and October 2016, the largest MLP ETF, AMLP had a standard deviation equal to 14.8%. As a comparison, the largest energy ETF, XLE, had a standard deviation of 19.61%.

MLPs are often treated as an alternative investment due to their considerable ownership of real assets. They also have a lower correlation with the broad equity and fixed income markets while simultaneously having characteristics of both. AMLP has 0.57 correlation with S&P 500 and -0.16 to the 20-year treasury.

MLP Investing options

Direct ownership

As of March 31, 2016, 118 energy MLPs were totaling $304 billion in market capitalization.

The most popular index tracking the MLP space is Alerian MLP. The index has 44 constituents and $298 billion market capitalization.

There are ten companies dominating the sector. They make up close to two-thirds of the Alerian MLP Index. The remainder consists of hundreds of small and mid-size partnerships.  

Direct MLP ownership is a popular strategy for yield-seeking investors. The direct investing also provides the most beneficial tax treatment of MLP distributions – tax deferral.

However, the biggest drawbacks of direct investing are the large tax filing cost and exposure to a single company.

Investors interested in direct ownership in MLPs should consider buying a basket of partnerships to diversify their risk more efficiently. They should also weight the tax benefits of direct ownership versus the cost of year-end tax filing.

ETFs and ETNs

MLP ETFs and ETNs have the most complex legal and tax structure of any other ETFs. Due to these complexities, most funds are structured as ETNs.

There are 28 MLP ETFs and ETNs currently listed on the exchange. Their total Asset Under Management (AUM) is $17.7 billion with the top 4 ETFs dominating the space with total AUM equal to $15.9 billion. 

AMLP

AMLP is the most popular and liquid MLP ETF. It tracks the Alerian MLP index. AMLP is the first ETF to address the complexity of direct MLP ownership.  This ETF offers a broad diversification to the largest publicly traded MLPs.

AMLP offers simplified tax filing by issuing standard 1099 form. Because of its legal structure, AMLP can pass the tax-deferred treatment of MLP distributions to its investors.

To satisfy the legal restrictions on ownership, AMLP is structured as a corporation, not an actual ETF.  AMLP pays taxes at the corporate level. The structure requires the fund to accrue the future tax liabilities of unrealized gains in its portfolio. Doing this is causing the fund to trail its underlying Alerian Index during bull markets and beat it during down periods.

AMJ

AMJ is the next most popular fund in this category. It is structured as an exchange-traded note.

ETNs are an unsecured debt instrument structured to track an underlying index’s return, minus management fees. Unlike exchange-traded funds, ETNs do not buy and hold any the underlying assets in the indexes they track. They represent a promise by the issuing bank to match the performance of the index.

AMJ is issued by JP Morgan and capped at the market value of $3.885 billion. Investors in AMJ have credit exposure to JP Morgan in case they are not able to pay the performance of the index.

Due to the lack of actual MLP ownership, AMJ can replicate the performance of the Alerian MLP index much closer than AMLP.

AMJ also issues single 1099 tax form. However, all its distributions are taxable as ordinary income, for up to 39.6% plus 3.8% of Medicare surcharge. AMJ distributions do not have the preferential tax treatment of AMLP and individual MLP ownership.

This ETF is suitable for short term investors willing to bet on the MLP sector and not interested in any potential income and tax benefits.

EMLP

EMLP is the only traditional ETF in this group. Because of the regulatory restrictions, EMLP holds only 25% stake in MLPs and the remaining 32% in Energy, 40% in Utilities and 2% in Basic Materials. Unlike the other funds, EMLP has a broader exposure to companies in the energy infrastructure sector. According to the prospectus, the fund invests in publicly traded master limited partnerships and limited liability Canadian income trusts,, pipeline companies, utilities, and other companies that derive at least 50% of their revenues from operating or providing services in support of infrastructure assets such as pipelines, power transmission and petroleum and natural gas storage in the petroleum, natural gas and power generation industries.

Mutual Funds

The three Oppenheimer mutual funds are dominating this niche. They manage almost 50% of the $20b AUM by MLP mutual funds.

The MLP mutual funds tend to have higher fees than most ETFs. They utilize the corporate structure which allows them to transfer the majority of the income and tax advantages to their shareholders.

Closed-End Funds

Closed-End funds (CEF) are another alternative for investing in the MLP sector. Similarly to mutual funds,  CEFs are actively managed. The difference is that they only issue a limited number of publicly traded shares.

Most MLP closed-end funds use leverage between 24% to 40%  to boost their income. These funds borrow money in order to increase their investments.


CEFs shares often trade at premium or discount from the NAV of their holdings. When purchased at a discount they can offer potential long-term gains to interested investors.

MLP CEFs also use the c-corp structure. They issue a 1099 form and pass current income and return on capital to their investors allowing for tax-deferral benefits on the distributions.


Investing in Small Cap Stocks

Small Cap Stocks

Small cap stocks are an important part of a diversified investment portfolio. They had provided high historical return and diversification, which are key factors in the portfolio management process.

Many flagship companies started as small businesses in a local market and evolved to large multinational corporations. Some of these success stories include McDonalds, which opened its first restaurant in Des Plaines, Illinois to become one of the biggest food chains in the world.

Research has shown that small-cap stocks overperformed a large cap over an extended period.

The below chart shows 15-year performance between IWM, Russell 2000 Small Cap ETF and SPY, S&P 500 Large Cap ETF. For that period IWM surged by 164% while SPY rose by 67%.


Once we include dividends, the 15-year annualized return of a small cap blend strategy becomes 8.66% versus 6.71% for a large cap strategy.

If we extend our period to 40 years (1975 – 2015), the small cap generated 14.25% annualized return while large cap produced 11.66%.

Investing in small companies comes with many caveats.  Even though they bring potentially high returns, they also impose high risk and uncertainty.

Small cap stocks market capitalization

Small cap companies have a market capitalization between $300 million and $2 billion dollars. Overall, the small size market is very fragmented. There are thousands of publicly traded small-size companies, but they only make 10-15% of the total market. The definition of a small-cap company varies widely among index providers and portfolio managers. Standard & Poor’s tracks their own S&P 600 Small Cap Index while FTSE Russell tracks the Russell 2000 Small Cap Index.

Very often, small companies are managed by their original founders.  They are usually new and innovative companies with competitive strengths in a particular local market or a specific product. It is not uncommon for companies to go back and forth between small, mid and large-cap rankings depending on their business cycle.

Niche market

Small cap companies often operate in a niche market where they have a distinct competitive advantage. Small businesses have a unique product or service, which they offer on either national or local level.  Unlike their bigger counterparts, which offer a variety of products in different geographies, small size companies tend to be more focused, with one or two flagship products. A particular example can be Coca Cola versus Red Bull. Coca-Cola offers hundreds of varieties of beverages worldwide while Red Bull offers only one type of energy drink.

Regularly small companies will start from a local market and grow nationwide.  Starbucks is a great example of a local coffee shop that moved up the ranks and became one of the top 100 large company in the USA and the world.

Small businesses with a unique product will often become an acquisition target for a larger corporation that wants to gain a presence in a growing higher margin market. Great example for that is PepsiCo acquiring Gatorade. PepsiCo wanted to get access to the fast growing market of sports drinks and instead of developing their own line; they decided to purchase an already established brand.

Growth potential

Small cap companies often have higher revenue growth than large size ones. Their competitive advantages, innovative strategy, flexibility and market positioning allows them to grow faster. It is easier to increase 25% when you start at $10 million of revenue versus $25% at $ 1 billion of revenue. Many times small companies do not even have a competition in their market niche. Think of Facebook before they went public. It is common for small firms to grow their revenue between 25% and 50% annually for several consecutive years.

Volatile prices

Investing in small cap stocks is risky. The high potential return of small caps comes with greater risk. The share price of small companies is more volatile and subject to larger swings than those of bigger companies.

IWM, the biggest small-cap ETF, has a beta of 1.22 to the equity market. As the comparison, the beta of SPY, the most traded large-cap ETF, is equal to 1. Beta measures the volatility of a security compared to the market as a whole. IWM beta of 1.22 shows that the ETF is historically 22% more volatile than the overall market.

Another measure of volatility is a standard deviation. It illustrates how spread out are the historical returns compared to the average annualized return of the investments. In our case, the 15-year standard deviation of IWM is 19.73% versus 14.14% for SPY.

As I mentioned earlier, the average 15-year return for a small cap stock is 8.66%. With a standard deviation equal to 19.73%, an average annual return can go between -11.07% and 28.39%. For SPY the average range is between -7.43% and +20.85% with annualized return of 5.25%. Based on this historical data we can claim that the small cap market has a much wider probability of returns. The high upside comes with a bigger downside.

Limited access

Small cap stocks lack the liquidity and trading volume of the large public corporations. This makes them more vulnerable to large price swings in short periods.

In times of economic recession, small companies can take a bigger hit in their earnings and may take a longer time to recover. Ten or fifteen percent decline in revenues can have a much more adverse impact on a small company than a larger one.

Due to their limited access to equity markets and loan financing, small size companies have a higher risk to go into bankruptcy if they run out of money.

Many small firms are start-ups with one innovative product and untested business models. Their dependency on just one product or service puts them in a very high-risk category in cases when the product or service does not appeal to their target customer base.

Inefficient market

Traders and portfolio managers often ignore small-cap companies. The focus is usually on large size companies, which frequently have 5 to 10 analysts following their earnings.  In fact, research analysts cover very few of the 2,000 stocks in the Russell 2000 index. Therefore, it is common that a small company does not have a full coverage by any industry analysts. This lack of interest and publicity produces conditions for inefficient pricing.   Active investors with a focus on the small cap market can scan the universe for undervalued and mispriced stocks and generate higher returns based on their valuation techniques and knowledge of the market.

Diversification

Investing in small cap companies can significantly contribute to the diversification of your portfolio.  Even though small stocks have a higher risk than larger ones, their correlation to the overall market is lower. A small blend strategy has 0.86 correlation to the overall US stock market and 0.56 to the broader international stock market.

A correlation equal to 1 shows the highest strength of the relationship between two asset categories. In the case of small cap, the correlation of 0.86 shows a weaker link with the overall market. Small cap prices does not fluctuate in the same magnitude and pace as the large cap companies.  While there is some influence by S&P 500, they follow an independent path.


How to invest in small cap stocks

Individual stocks

You can invest in small size companies by buying them directly on the open market. There are over 2,000 listed small size companies in various industries and stages of their business cycle. Naturally, you cannot invest in all 2,000 stocks. You have to find a way to narrow down your criteria and select stocks based on certain factors. Very few small companies have analyst coverage. Therefore investing in small caps stocks will require doing your own research, analysis, and valuation.

When you invest in any company directly, being that a small or large size, you have to keep in mind that concentrated positions can adversely affect your portfolio performance if that company has a bad year or goes bankrupt. While everyone’s risk sensitivity is different, I would recommend limiting the range of each individual stock investment to 1% – 2% of your portfolio.

Tax Impact

For the best tax impact, I recommend putting small cap stocks either in taxable or Roth IRA accounts. Small cap companies have higher expected return combined with a higher expected volatility. If you hold your stocks in a taxable account, you can take advantage of tax loss harvesting opportunities if a particular stock in your portfolio is trading at lower levels than original purchase price. Tax loss harvesting is not available in Roth IRA, Traditional IRA, and 401k accounts. I

If you have small-cap stocks with solid long-term return prospects, keeping them in a taxable account will also allow you to pay the favorable long-term capital gain tax when you decide to sell them.

Having stocks in a Roth IRA account will have even better tax treatment – zero tax at the time of sale.

Passive indexing

ETFs and index mutual funds are the top choice for passive small cap investing. They provide a low-cost alternative for investors seeking a broader exposure to the small cap market. Small cap ETFs come in different shapes and forms. The table below shows a list of the most traded small cap ETFs with AUM above $500 million:

List of Small Cap ETFs

TICKER

FUND NAME EXPENSE RATIO AUM SPREAD % 1 YEAR 5 YEAR 10 YEAR SEGMENT

AS OF

IWM iShares Russell 2000 ETF 0.20% $27.79B 0.01% 5.69% 12.28% 6.01% Equity: U.S. – Small Cap 10/26/2016
IJR iShares Core S&P Small Cap ETF 0.07% $20.83B 0.03% 7.35% 14.16% 7.56% Equity: U.S. – Small Cap 10/26/2016
VB Vanguard Small-Cap Index Fund 0.08% $13.94B 0.03% 5.59% 13.14% 7.40% Equity: U.S. – Small Cap 10/26/2016
VBR Vanguard Small Cap Value Index Fund 0.08% $8.16B 0.04% 7.31% 14.20% 6.77% Equity: U.S. – Small Cap Value 10/26/2016
IWN iShares Russell 2000 Value ETF 0.25% $6.72B 0.01% 9.39% 12.17% 4.82% Equity: U.S. – Small Cap Value 10/26/2016
IWO iShares Russell 2000 Growth ETF 0.25% $6.35B 0.02% 1.92% 12.31% 7.01% Equity: U.S. – Small Cap Growth 10/26/2016
VBK Vanguard Small-Cap Growth Index Fund 0.08% $4.93B 0.04% 3.50% 11.36% 7.25% Equity: U.S. – Small Cap Growth 10/26/2016
IJS iShares S&P Small-Cap 600 Value ETF 0.25% $3.85B 0.03% 10.26% 14.31% 6.57% Equity: U.S. – Small Cap Value 10/26/2016
SCHA Schwab U.S. Small-Cap ETF 0.06% $3.78B 0.04% 5.46% 13.03% Equity: U.S. – Small Cap 10/26/2016
IJT iShares S&P Small-Cap 600 Growth ETF 0.25% $3.47B 0.08% 4.41% 13.74% 8.42% Equity: U.S. – Small Cap Growth 10/26/2016
DES WisdomTree SmallCap Dividend Fund 0.38% $1.59B 0.12% 11.96% 14.36% 6.35% Equity: U.S. – Small Cap 10/26/2016
FNDA Schwab Fundamental US Small Co. Index ETF 0.32% $1.04B 0.06% 6.38% Equity: U.S. – Small Cap 10/26/2016
SLYG SPDR S&P 600 Small Cap Growth ETF 0.15% $807.64M 0.27% 4.61% 13.74% 9.00% Equity: U.S. – Small Cap Growth 10/26/2016
VTWO Vanguard Russell 2000 Index Fund 0.15% $675.74M 0.06% 5.67% 12.19% Equity: U.S. – Small Cap 10/26/2016
XSLV PowerShares S&P SmallCap Low Volatility Portfolio 0.25% $651.46M 0.09% 12.43% Equity: U.S. – Small Cap 10/26/2016
SLYV SPDR S&P 600 Small Cap Value ETF 0.15% $610.42M 0.21% 10.46% 14.43% 7.38% Equity: U.S. – Small Cap Value 10/26/2016
SLY SPDR S&P 600 Small Cap ETF 0.15% $512.80M 0.25% 7.10% 13.99% 8.19% Equity: U.S. – Small Cap 10/26/2016

Benchmark

One of the main differences between small-cap ETFs is the index they track. Each of the three main Small Cap Indexes is constructed differently.

Russell 2000 (IWM) includes the bottom 2,000 of the largest 3,000 publicly traded companies. The average market cap of the constituents of Russell 2000 is equal to $1.9 billion. The median is 698 million. And the largest stock has a market cap of $6 billion.

S&P 600 Index (IJR) tracks a smaller subset of the market. It includes only 600 companies.  As of April 2016, the market capitalization of companies included in the Index ranged from US$ 400 million to US$ 1.8 billion. S&P 600 also sets additional requirements for liquidity, public float, sector and financial viability.

CRSP SmallCap index (VB) tracks the 2%-15% percentile of the total market. It has 1,462 companies. The smallest company has a market capitalization of $21 million; the largest has $7.9 billion. The average size is $1.85 billion. The median is $1.44 billion. It is worth noting that VB tracked Russell 2000 Index through May 16, 2003; MSCI US Small Cap 1750 Index through January 30, 2013; CRSP US Small Cap Index thereafter

Focus

Another big difference between Small Cap ETFs is their segment focus. There are three main segments – small cap blend, growth, and value. The blend strategy invests in the wide universe of small caps, which mechanically tracks the designated index. The value strategy tracks a specific group of companies that have a  certain level of Price to Earnings, Price to Sales, Price to Book, dividend yield, and other fundamental ratios. Growth strategy invests in a group of stocks that meet certain criteria for price, revenue and earnings growth.

Tax Impact

ETFs and index funds have more favorable tax treatment than actively traded mutual funds. Due to their passive nature and legal structure, these funds rarely release capital gains and losses to their shareholders. Therefore, investors looking to optimize taxes in their investment portfolio should consider these type of funds.

Active investing

This strategy includes investing in actively managed mutual funds. These funds are run by management teams. They normally charge higher fees than comparable ETF to cover for the trading, administrative, marketing and research expenses.  Mutual funds follow a benchmark, which is usually one of the three main indices described earlier – S&P 600, Russell 2000 or CSRP Small Cap Index. Because of their higher fees than comparable ETFs, fund managers are often expected to outperform their benchmark.

Active funds normally focus in one of the three main segments – blend, growth or value. The fund managers utilize a formal selection process that identifies a number of companies, which meet certain proprietary criteria. The end goal is to select those companies that will achieve a higher return than the undying benchmark. Since the characteristics of value vs. growth strategy can be subjective, it is not an unusual that the same company is owned by both value and growth oriented funds.

In the past 7-8 years, many of the active managers have been criticized for underperforming the market. Part of the reason is that we experienced a very long market rally driven by a small number of flagship companies.

Tax Impact

Actively managed mutual funds have a more complex tax structure. They must transfer most of their dividends and capital gains and losses to their shareholders. Mutual funds will often have large amounts of long or short-term gains and losses released in December regardless how long you had kept in your portfolio, to avoid paying additional taxes I recommend placing your actively managed mutual funds in tax deferred and tax exempt accounts. Another alternative is to look for tax-managed funds. They tend to have a low turnover ratio and tend to report long-term gain and losses less frequently.


10 Ways to reduce taxes in your investment portfolio

10 Ways to reduce taxes in your investment portfolio

Successful practices to help you lower taxes in your investment portfolio

A taxable investment account is any brokerage or trust account that does not come with tax benefits. Unlike Roth IRA and Tax-Deferred 401k plans, these accounts do not have many tax advantages. Your contributions to the account are with after-tax dollars. This is money you earned from salary, royalties, the sale of a property, and so on. All gains, losses, dividends, interest, and other income from any investments are subject to taxes at the current tax rates.  In this post, we will discuss several successful practices that can help you lower taxes in your investment portfolio

Why investors put money into taxable accounts? They provide flexibility and liquidity, which are not available by other retirement accounts. Money is readily accessible for emergencies and unforeseen expenses. Many credit institutions take these accounts as a liquid asset for loan applications.

Since investment accounts are taxable, their owners often look for ways to minimize the tax impact at the end of the year. Several practices can help you reduce your overall tax burden.

1. Buy and Hold

Taxable investment accounts are ideal for buy and hold investors who don’t plan to trade frequently. By doing that investors will minimize trading costs and harvest long-term capital gains when they decide to sell their investments. Long-term capital gains are taxable at a favorable rate of 0%, 15% or 20% plus 3.8% Medicare surcharge. In contrast, short-term gains for securities held less than a year are taxed at the higher ordinary income level.

Individuals and families often use investments accounts for supplemental income and source of liquidity. Those investors are usually susceptible to market volatility. Diversification is the best way to lower market risk. I strongly encourage investors to diversify their portfolios by investing in uncorrelated assets including mid-cap, small-cap, international stocks, bonds, and real assets.

2. Invest in Municipal Bonds

Most municipal bonds are exempt from taxes on their coupon payments. They are considered a safer investment with a slightly higher risk than Treasury bonds but lower than comparable corporate bonds.

This tax exemption makes the municipal bond suitable investment for taxable accounts, especially for individuals in the high brackets category.

3. Invest in growth non-dividend paying stocks

Growth stocks that pay little or no dividends are also a great alternative for long-term buy and hold investors. Since the majority of the return from stocks will come from price appreciation, investors don’t need to worry about paying taxes on dividends. They will only have to pay taxes when selling the investments. 

4. Invest in MLPs

Managed Limited Partnerships have a complex legal and tax structure, which requires them to distribute 90% of their income to their partners. The majority of the distributions come in the form return on capital which is tax-deferred and deducted from the cost basis of the investments. Investors don’t owe taxes on the return on capital distributions until their cost basis becomes zero or decide to sell the MLP investment.

One caveat, MLPs require K-1 filing in each state where the company operates, which increases the tax filing cost for their owners.

 5. Invest in Index Funds and ETFs

Index funds and ETFs are passive investment vehicles. Typically they track a particular index or a benchmark. ETFs and index funds have a more tax-efficient structure that makes them suitable for taxable accounts. Unlike them, most actively managed mutual funds frequently trade in and out of individual holdings causing them to release long-term and short-term capital gains to shareholders.

6. Avoid investments with a higher tax burden

While REITs, taxable bonds, commodities, and actively managed mutual funds have their spot in the investment portfolio, they come with a higher tax burden.

The income from REITs, treasuries, corporate and international bonds is subject to the higher ordinary income tax, which can be up to 39.6% plus 3.8% Medicare surcharge

Commodities, particularly Gold are considered collectibles and taxed at a minimum of 28% for long-term gains.

Actively managed funds, as mentioned earlier, periodically release long-term and short-term capital gains to their shareholders, which automatically triggers additional taxes.

7. Make gifts

You can use up to $14,000 a year or $28,000 for a couple to give to any number of people you wish without tax consequences. You can make gifts of cash or appreciated investments from your investment account to family members at a lower tax bracket than yours.

8. Donate 

You can make contributions in cash for up to 50% of your taxable income to your favorite charity. You can also donate appreciated stocks for up to 30% of AGI. Consequently, the value of your donation will reduce your income for the year. If you had a good year when you received a big bonus, sold a property or made substantial gains in the market, making donations will help you reduce your overall tax bill for the year.

9. Stepped up cost basis

At the current law, the assets in your investment account will be received by your heirs at the higher stepped-up basis, not at the original purchase price. If stocks are transferred as an inheritance directly (versus being sold and proceeds received in cash), they are not subject to taxes on any long-term or short-term capital gains. Your heirs will inherit the stocks at the new higher cost basis.  However, if your investments had lost value over time, you may wish to consider other ways to transfer your wealth. In this case, the stepped-up basis will be lower than you originally paid for and may trigger higher taxes in the future for your heirs.

10. Tax-loss harvesting

Tax-loss harvesting is selling investments at a loss. The loss will offset gains from other the sale of other securities. Additionally, investors can use $3,000 of investment losses a year to offset ordinary income. They can also carry over any remaining amounts for future tax filings.


A Guide to Investing in REITs

Investing in REITs

On August 31, 2016, S&P 500 will introduce a new sector – Real Estate. Up until now real estate companies, also known as REITs,  belonged to the Financial sector. They were in the company of large financial and insurance corporations. The new category will have 27 stocks, $567 billion of market capitalization and an approximate weight of 3% of the total S&P 500 market value.

With the addition of Real Estate as a separate sector in S&P indices, many active managers will have to aline their current portfolios with the new sector structure.

What is a REIT?

A real estate investment trust (REIT) is a company that owns and manages income-producing real estate. It represents a pool of properties and mortgages bundled together and offered as a security in the form of unit investment trusts.

REITs invest in all the main property types with approximately two-thirds of the properties in offices, apartments, shopping centers, regional malls, and industrial facilities. The remaining one-third is divided among hotels, self-storage facilities, health-care properties, prisons, theaters,  golf courses and timber.

The total market capitalization of all publicly-traded REITs is equal to $993 billion. The majority of it, $933 billion belongs to Equity REITs and the remainder to Mortgage and other financing REITs.

There are 219 REITs in the FTSE NAREIT All REITs Index. 193 of them trade on the New York Stock Exchange

Legal  Status

REITs are subject to several regulations. To qualify as a REIT, a real estate firm must pay out 90% of its taxable income to shareholders as dividends. The REIT can deduct the dividends paid to shareholders from its taxable income. Thus their income is exempt from corporate-level taxation and passes directly to investors. Other important regulations include:

  • Asset requirements: at least 75% of assets must be real estate, cash, and government securities.
  • Income requirements: at least 75% of gross income must come from rents, interest from mortgages, or other real estate investments.
  • Stock ownership requirements: shares in the REIT must be held by a minimum of 100 shareholders. Five or fewer individuals cannot (directly or indirectly) own more than 50% of the value of the REIT’s stock during the last half of the REIT’s taxable year.

Distributions

Dividend distributions for tax purposes are allocated to ordinary income, capital gains, and return on capital, each of them having different tax treatment. REITs must provide shareholders with guidance on how to treat their dividends for tax purposes.  The average distribution breakdown for 2015 was approximately 66% ordinary income, 12% return on capital, and 22% capital gains.

REITs distributions have grown substantially in the past 15 years. The total REIT distributions in 2000 were under $8 billion dollar. Just between 2012 and 2015, REITs distribution rose up from $28.8 billion to $44.9 billion, or 44%.

Tax implicationsThe majority of REIT dividends are considered non-qualified dividends and taxed as ordinary income, up to the maximum rate of 39.6 percent, plus a separate 3.8 percent Medicare surtax on investment income.

Capital gains distributions are taxable at either 0, 15 or 20 percent tax rate, plus the 3.8 percent surtax.

Return-on-capital distributions are tax-deferred. They reduce the cost basis of the REIT investment.

When a REIT distributes dividends received from a taxable REIT subsidiary or other corporation, those distributions are taxed at the qualified dividend rate of 0, 15, or 20 percent, plus the 3.8 percent surtax.

Timber REITs

One REIT sector makes an exception from the above rule. Timber REITs have a favorable tax treatment from the IRS. Distributions from timber REITs such as RYN, PCL, PCN & WY are considered long-term capital gains and therefore are taxable at the lower capital gain rate (0, 15% or 20% plus 3.8% Medicare surcharge).

 Economic Cycle 

Individual REIT sectors have different sensitivity to cyclical factors.  Industrial, hotel, and retail REITs have the biggest exposure to economics cycles. Their occupancy and rental rates are extremely sensitive to economic conditions. Cyclical downturns in the economy, recession, and weak consumer spending, can significantly hurt the revenue stream of these REITs.

On the other hand, health care REITs tend to have long-term rental agreements and are more sheltered from market volatility.

Interest Rates

Since many REITs use bank loans and other external financings to expand their business, they have benefitted significantly from the current low-interest-rate environment. Furthermore, many yield-seeking investors turned to REITs for higher income. If low-interest rates remain, REITs will likely expand their base to a broader range of market participants.

Interest rates can impact REIT’s performance differently depending on two main factors – debt and lease duration.

Loan maturities

As a result of the current low rates, many REITs have increased their leverage and therefore have high sensitivity to interest changes. If interest rates rise, REITs with near-term loan maturities will need to refinance at higher rates. Thus their interest payments will go up, which will lead to less cash available for dividends. Therefore, REITs with higher levels of debt and short-term maturities will perform worse than REITs with less debt and long-dated maturity schedules.

At the same time, REITs with lower debt levels relative to their cash flows, all else equal, will perform better in a rising-rate environment.

Lease duration

While higher interest rates would affect all REITs, industry subsectors would be affected differently, depending on lease durations. REITs with shorter lease durations will perform relatively better in a rising-rate environment because they can seek higher rents from tenants as rates rise than could REITs with longer lease durations. The higher rents can offset the negative impact of higher interest expense. Hotel REITs usually have the shortest lease durations, followed by multifamily properties and self-storage.

Healthcare, office, and retail REITs usually sign long-term leases. Therefore rising interest rates will potentially hurt these REITs due to their inability to adjust rental contracts to offset rising costs.

Risk and return

Real Estate Investment Trusts historically have been more volatile than S&P 500. The 40-year standard deviation of the REIT’s sector is 17.16% versus 16.62% for the S&P 500 and 10.07% for the 10-year Treasury. During this 40-year period, REITs achieved a 13.66% cumulative annual return versus 11.66% for S&P 500 and 7.39% for the 10-year Treasury. (www.portfoliovisualizer.com)

Furthermore, the 10-year (2006-15) standard deviation of the REIT sector is 22.01% versus 18.02% for the S&P 500 and 9.54% for 10-year Treasury. For the same period, REITs reported 7.83% cumulative annual return versus 6.96% for S&P 500 and 4.57% for 10-year Treasury. (www.portfoliovisualizer.com)

Among the best five-year REIT sector performers were Retail, Self-Storage, and Industrial. For the same period, worst performers were Mortgage, Hotel and Office RETS.

Valuations

With respect to pricing, REITs are reaching high valuations levels. The current Price to Fund to Operations ratio is hovering around 18, which is slightly above the historical average of 16. While the P/FFO ratio remain reasonable compared to historical figures, further price rally in REITs not supported by the increase in cash flows may impose a significant risk for sector overheating.

Diversification

Even though REITs are publicly traded companies, very often they are considered an alternative asset due to their weak relationship with the other asset classes – equities and fixed income. US REITs have a relatively low correlation with the broader stock market. The 40-year correlation is equal to 0.51, while the 10-year correlation is  0.73. The correlation between REITs and 10-year Treasury is equal to -0.06, while that with Gold is 0.09.

This low correlation with other asset classes makes the REITs a solid candidate for a broadly diversified investment portfolio.


Investing Strategies

Directly

There are 219 publicly-traded REITs. 27 of them are included in the S&P 500 index. If you decide to invest in a single REIT or basket of REITs, you need to consider company-specific risk, management, sub-sector, regional or national market exposure, leverage, lease duration, history, and distribution payments.

Real Estate ETFs

VNQ

VNQ dominates the REITs ETF space as the largest and second-cheapest ETF. It includes a broad basket of 150 securities. The ETF tracks the MSCI US REIT Index, which includes all domestic REITs from the MSCI US Investable Market 2500 Index. This ETF doesn’t include any mortgage, timber, and tower REITs. It has an expense ratio of 0.12% (second lowest to SCHH). It has $32.4 billion of assets under management and Morningstar rating of 4. The fund holds a diversified portfolio across all property sectors. Retail REITs are the largest holding, at 25% of assets, Specialized REITs make up 16.50%, office, 12.6% residential, 15.7%, healthcare, 12.3%, diversified, 8%, hotel and resort, 5.3%, and industrial, 4.7% REITs.

IYR

IYR tracks the Dow Jones U.S. Real Estate Index. It is the most diversified REIT ETF. Unlike other ETFs which hold only equity REITs, IYR holds mortgage, timber, prison and tower REITs including companies like American Tower, Weyerhaeuser Co, Annaly Capital Management NLY and Crown Castle International Corp. IYR has three stars by Morningstar and has an expense ratio of 0.45%. IYR’s holdings are broken by Specialized REITs, (27.09%), Retail, 19.74%, Residential, 12.70%, Office, 10.00%, Health Care, 9.88%, Mortgage REITs, 4.90%, Industrial, 4.56%, Diversified, 4.51%, Hotel & Resort, 3.56%, Real Estate Services, 2.06%

ICF

ICF tracks an index of the 30 largest publicly traded REITs excluding mortgage and tower REITs. The design of this index capitalizes on the relative strength of the largest real estate firms and the conviction for consolidation in the real estate market. The ETF includes Retail REITs, 24.84%, Specialized REITs, 18.71%, Residential, 18.08%, Office, 15.23%, Health Care, 14.41%, Industrial, 5.79%, Hotel & Resort REITs, 2.56%.

RWR / SCHH

RWR / SCHH are the smallest of the five funds. They track Dow Jones US Select REIT Index. The index tracks US REITs with a minimum market cap of $200 million. The index also excludes mortgage REITs, timber REITs, net-lease REITs, real estate finance companies, mortgage brokers and bankers, commercial and residential real estate brokers and real estate agents, homebuilders, hybrid REITs, and large landowners of unimproved land. The funds’ portfolio holds a diversified range of REITs across property sectors similar to other ETFs.

SCHH has the lowest expense ratio of 0.07% all REITs ETFs while RWR has an expense ratio of 0.25%.

Performance 

Comparing the performance of the top ETFs in the past ten years, we can see a clear winner. VNQ is leading by price return, total return, and Sharpe Ratio.  Next in line are RWR and ICF. IYR takes the last spot.

Having the largest number of holdings, VNQ overweights small size REITs relative to the industry average. Hence it benefited from the smaller REITs outpacing the growth of their bigger competitors.

IYR did not benefit from being the most diversified REIT ETF. The mortgage and specialized REITs have lagged behind the performance of the traditional equity REITs.

Mutual Funds

Mutual funds are actively managed investment vehicles. They typically use an index as their benchmark.  The goal of the fund manager is to outperform their benchmark either on a risk adjusted or absolute return basis.  The fund manager can decide to overweight a particular REIT if he or she believes the company will outperform the benchmark. Many times the managers will look for mispricing opportunities of individual REITs.

Active funds usually charge higher fees than passively managed ETFs due to higher research, management, administrative and trading costs. However, many investors believe that after subtracting their fees, active managers cannot beat the market in the long run.

In my analysis, I selected a pool of five actively managed funds which are open to new investors and have an expense ratio less than 1% – VGSLX,  DFREX, TRREX, CSRSX and FRESX.

All five funds have high ratings from Morningstar and robust historical performance.

VGSLX and DFREX have the largest number of holdings, 150 and 149 respectively, and maintain the lowest expense ratio. Both funds lean more towards small and micro-cap REITs relative to the average in the category.

The other three funds, TRREX, CSRSX and FRESX manage smaller pools of REITs. CSRSX and FRESX have the highest turnover: 58% and 34% respectively.

Performance

While the 1-year returns are quite variable, the long-term performance among the five funds is relatively consistent. Vanguard REIT Index Fund, VGSLX,  has the lowest fee and the highest 10-year return of 7.6%. Cohen & Steers Realty Shares Fund, CSRSX, is second with 7.5% annual return. CSRSX has the lowest 10-year standard deviation of 25.2%. VGSLX edges slightly ahead with the highest Sharpe Ratio of 0.39. Vanguard and DFA funds benefitted from low expense ratio and larger exposure to mid and small size REITs, which had better 10-year performance than larger REITs.

It is worth noting that the 10-year Sharpe Ratio for all REITs sector is lower than the Sharpe Ratio of S&P 500. The Sharpe Ratio calculated the risk-adjusted returns of a particular investment. In this case, the risk-adjusted returns of REIT lag behind the overall equity market.

When you consider investing in REITs mutual funds,  pay attention to management style, expense ratio, turnover, dividends, the number of holdings, and their benchmark.

Where to allocate REITs investments?

REITs are often attractive for their high dividend income. As I mentioned earlier, the majority of the REITs distributions are treated as ordinary income and therefore taxed at the investors’ tax rate. Investors in high tax brackets can pay up to 39.6% rate plus 3.8% Medicare surplus tax on the investment income.

Because of their unfavorable tax status, most REITs may not be suitable for taxable investment accounts.  Tax-sensitive investors may want to consider placing REITs in Tax Advantage accounts like Roth IRA, Traditional IRA, and 401k.

Since timber REITs receive favorable tax treatment, they are an exception from the above rule. Investors may choose to hold them in taxable investment accounts.

There are two scenarios under which REITs could be an appropriate fit for a taxable account.

First, investors in the lower tax bracket will be less impacted by the tax treatment of the REITs income.

Second, investing in REITs with a history of making significant capital gain and return on capital distributions. These types of payments have more favorable tax treatment at the lower long-term capital gains tax rate.

A beginner’s guide to ETF Investing

Guide to ETFs

What is an ETF?

ETF stands for an exchange-traded fund. The fund is a passively managed marketable security that tracks an index, a commodity, or a pool of bonds. ETFs trade on the stock exchange, and their price fluctuate throughout the day.

By design, ETFs do not produce positive alpha. Alpha is the difference between the fund and the benchmark performance.  They strictly follow their index, and as a result, their alpha is always zero.

ETFs popularity spiked in the past several years due to the rise of robo-advisers, an increase in competiton, and lowe management fees. At the same time, many emblematic active managers underperformed their benchmarks and saw significant fund outflows.

ETF history

The ETF industry was born as a result of the market crash in October 1987. The initial goal behind ETFs was to provide liquidity and mitigate volatility for market participants. Over the last 20 years, they became a favorite investment vehicle for individual investors and asset managers. Today, globally, there are 6,870 ETF products on 60 exchanges and over $5 trillion of assets under management.

ETF vs. Mutual Fund

The media and investors often compare ETFs with mutual funds.  In contrast with ETFs, the mutual fund managers actively look for securities in an attempt to beat their designated benchmark.

ETFs typically have higher daily liquidity and lower fees than most mutual funds.  This makes them an attractive alternative for many individual investors.

Underlying Index

There are significant variations in the index composition between indices tracking the same asset class.  The ETFs structure and performance reflect these differences.

In the small-cap space, for example, IJR tracks the S&P 600 Small-Cap index, and IWM follows Russell 2000 Small Cap index. As the name suggests, the S&P index has 600 constituents, while the Russell index has 2,000 members. While there are many similarities and overlaps between the two, there are also significant variations in their returns, risk, and sector exposure.

In the Emerging market space, indices provided by MSCI include South Korea in their list of emerging market countries. At the same time, indices run by FTSE exclude South Korea and have it in their developed country list.

Investors seeking to manage their exposure to a particular asset class through ETFs need to consider the index differences and suitability against their overall portfolio.

 Fees

The fees are the cost associated with managing the fund – transaction cost, exchange fees, administrative, legal, and accounting expenses. They are subtracted from the fund performance. The costs are reported in the fund prospectus as an expense ratio. They can be as low as 0.08% and as high as 2% and more. The percentage represents the total amount of management fees over the value of assets under management.

Consider two ETFs that follow the same index.  All else equal, the ETF with the lower fee will always outperform the ETF with the higher one.

Liquidity

The ETF liquidity is critical in volatile markets and flash-sales when investors want to exit their position.

Asset under management, daily volume, and bid/ask spread drive the ETF liquidity. Larger funds offer better liquidity and lower spread.

The liquidity and the spread will impact the cost to buy or sell the fund. The spread will determine the premium you will pay to purchase these funds on the stock exchange. The discount is what you will need to give up to sell the ETFs. The lower the spread, the smaller difference between purchase and sale price will be. Funds with less spread will have lower exit costs.

Exchange Traded Notes

Exchange Traded Notes are an offshoot of the ETFs products. ETNs are structured debt instruments that promise to pay the return on the tracking assets. This structure is very popular for Oil, Commodity, and Volatility trading. They offer flexibility and easy access for investors to trade in and out of the products.

I believe that long-term investors should avoid Exchange Traded Notes (ETNs), volatility (VIX) ETFs, inverse, and leveraged (2x and 3x Index) ETFs and ETNs products. While increasing in popularity and liquidity, they are not appropriate for long-term investing and retirement planning. These types of funds are more suitable for daily and short-term trading. They incur a higher cost and have a higher risk profile.

Smart Beta ETFs

Smart Beta ETFs are also increasing in popularity. While the name was given for marketing purposes, this particular breed of ETFs uses a single or multi-factor approach to select securities from a pre-defined pool – S&P 500, Russell 2000, MSCI world index, or others.

The Single Factor ETFs like Low Volatility or High Dividend are strictly focusing on one particular characteristic. They offer a low-cost alternative to investing in a portfolio of income generating or less volatile stocks.

The multi-factor ETFs are a hybrid of active and index management. ETF providers have established an in-house index that will follow the rules of their multi-factor model. The model will select securities from an index following specific parameters with the intention of outperforming the index. The fund will buy only the securities provided by the model. The multi-factor ETFs are competing directly with mutual funds, which use similar techniques to select securities. However, they have a lower cost, better transparency, and an  easy entry point.

Currency Hedged

Currency Hedged International ETFs is another newcomer in the space. Their goal is to track a foreign equity index by neutralizing the currency exposure. They can be attractive to investors with interest in international markets who are concerned about their FX risk.  Some of the more popular funds in this category include HEDJ, which tracks Europe developed markets, and DXJ, which follows Japan exporting companies.

How to invest?

ETFs are a great alternative to all investment accounts. Due to their passive management, low turnover, and tax-advantaged structure, they are a great option for taxable and brokerage accounts.

For now, they have not made their way to corporate 401k plans, where mutual funds are still dominating. I am expecting this to change as more small and mid-size companies are looking for low-cost solutions for their workplace retirement plans.

Tax-sensitive investors, however, need to consider all circumstances before adding ETF holdings to their portfolio. Their tax treatment follows the tax treatment of their underlying assets.