Market Outlook 2019
Happy New Year to all!
2018 kept us on our toes. It seems that 2019 is promising to do the same.
All major world indices posted declines in 2018. S&P 500 finished lower by -4.5%. While the small-cap S&P 600 was down-8.5%. The International MSCI EAFE closed -13.8% cheaper for the year. The Bloomberg Aggregate Bond Index finished 2018 barely positive with most gains generated in the last quarter as most investors moved to Treasuries as a result of the increased volatility in the equity markets. Gold also ended in negative territory despite the 7.5% gain in the last quarter.
Major indices in 2018
| Index | Q1 2018 | Q2 2018 | Q3 2018 | Q4 2018 | FY 2018 |
| S&P 500 Large-Cap (SPY) | -1.00% | 3.55% | 7.65% | -13.52% | -4.56% |
| S&P 600 Small-Cap (IJR) | 0.57% | 8.69% | 4.87% | -20.18% | -8.49% |
| MSCI EAFE (EFA) | -0.90% | -1.96% | 1.52% | -12.62% | -13.81% |
| Barclays US Aggregate Bond (AGG) | -1.47% | -0.18% | -0.08% | 1.85% | 0.10% |
| Gold (GLD) | 1.73% | -5.68% | -4.96% | 7.53% | -1.94% |
Source: Morningstar
We will remember 2018 with the return of volatility. Investors enjoyed relatively calm markets in 2017, which had only 8 trading days when the S&P 500 moved more than 1% in either direction, 5 down and 3 up days. For comparison, 2018 had 65 trading days when the index moved more than 1%, split evenly between positive and negative days. Overall 2018 had more positive trading days 131 versus 119. However, the average positive session was +0.69% versus the average negative session of -0.81%.
CBOE Volatility Index (^VIX) – 2017-2018
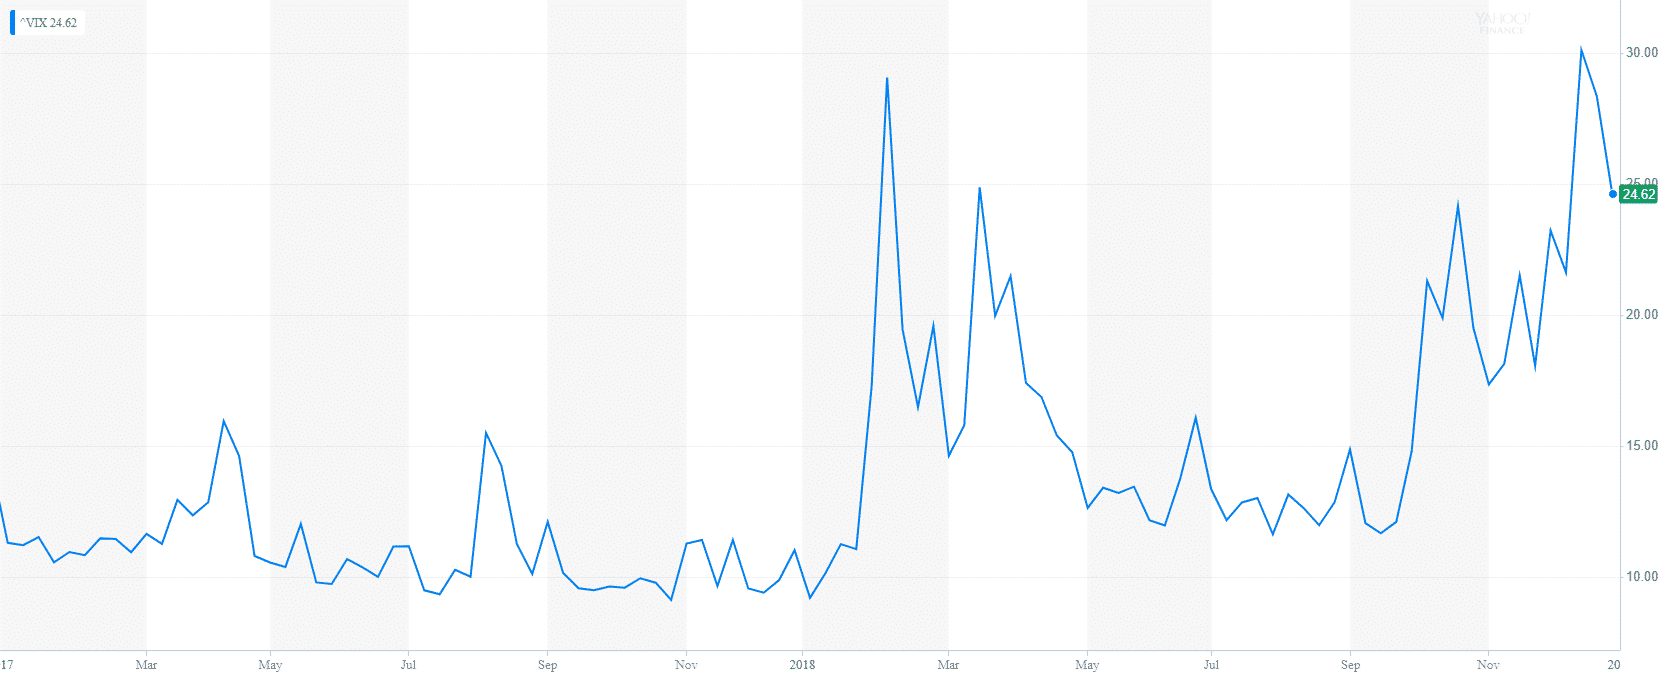
So, what led to this outcome. Unlike other bear markets, no single catalyst that caused this market selloff. But there was a combination of factors that formed a perfect storm and pushed the markets over the edge. In my previous post from November and December 2018, I talked about a list of these factors. Let me go over some of the most important ones.
Corporate buybacks
A big contributor to the positive returns earlier in the year was the companies’ share buybacks. After TCJA reduced the corporate tax rate to 21%, many corporations found themselves with extra cash, which they used to buyback their own stock. After the lockout period in October and the first spikes in volatility, the buybacks declined significantly.
High valuations
After a 9-year bull market and a record low-interest environment, equity valuations reached levels not seen since the tech bubble. The S&P 500 was trading at P/E of 24.9 in the early January of 2018, away above the average level of 15.7. Even after the market sell-off S&P 500 is trading around 19 P/E.
Furthermore, the Shiller PE Ratio reached 33.3, one of the highest levels in history. After the market correction, the ratio stands at 27, away above the average of 16.5.
While the traditional Price to Earnings ratio is calculated based on current or estimated earnings levels, the Schiller ratio calculates average inflation-adjusted earnings from the previous ten years. The ratio is also known as the Cyclically Adjusted PE Ratio (CAPE Ratio) or PE10.
Price of Oil
After reaching $74.15 per barrel in October, US crude oil tumbled to $43, a 42% drop. While lower crude prices are pushing down on inflation, they are hurting energy stocks, which barely recovered from the previous fall in oil prices. Furthermore, the oil’s rapid decline is fueling fears for global oversupply and slowing economic growth.
The Fed’s continued hiking of interest rates in the US was not coordinated with its counterparts in the ECB, the UK, and Japan. Currently the US 10-year treasury yields 2.58%. At the same time, the German 10-year bund now yields 0.15%, while Japanese 10-year government bond went back in the negative territory of -0.01%. Combining the higher US rates with failing = Brexit talks, Italian budget crisis, and negative trade war outcome has led to a strong US dollar reaching a 17-month high versus other major currencies.
Strong dollar
Given that 40% of S&P 500 companies’ revenue comes from foreign countries, the strong dollar is making Americans goods and services more expensive and less competitive abroad. Furthermore, US companies generating earnings in foreign currency will report lower US-dollar denominated numbers.
Slowing global growth
The market decline in the last three months of 2018 came in the backdrop of strong corporate earnings and record high consumer optimism. Overall, the S&P 500 members reported record earnings in the Q3 of 2018. 78% of them have reported better than expected actual earnings with an average earnings growth rate of 25.2%.
On the other side, a growing number of companies in the S&P 500 (58 or 12%) have issued negative earnings guidance for Q4 2018 and beyond. Most recently Apple reported lower revenue guidance as a result of weak demand in China and lower than expected iPhone replacement in the US.
Corporate CFOs are starting to take a more defensive approach. Business investment grew only at a 0.8% annual rate in the third quarter, down from 8.7% in the second quarter. This was the slowest pace since the fourth quarter of 2016.
The investment bank Nomura also came out with the forecast expecting global growth to slow down. Their economists predicted that global growth in 2019 would hit 3.7% and temper to 3.5% in 2020 from 3.9% in 2018. According to Nomura, the drivers for the slowdown include waning fiscal stimulus in the U.S., tighter monetary policy from the Federal Reserve, increased supply constraints and elevated risk of a partial government shutdown
Trade War
The impact of President Trump’s trade war
The latest global PMI (Purchasing Managers Index) survey shows a slowdown in global production growth. According to JP Morgan and HIS Markit Survey: “The global manufacturing sector continued to register a subdued performance at the close of 2018. Output growth remained weak, while rates of expansion in new orders and employment both slowed. The trend in international trade flows also remained weak, with new export business declining for the fourth straight month. The JP Morgan Global Manufacturing PMI™ fell to a 27-month low of 51.5 in December, down from 52.0 in November. The average reading over the fourth quarter (51.8) was the lowest since quarter three of 2016.”
The housing market is slowing down
Both existing and new home sales have come down this year. Rising interest rates, higher cost of materials, labor shortage and high real estate prices in major urban areas have led to a housing market slow down. Existing home sales dropped 3.4% in September coming down for six months in a row this year. New building permits are down 5.5% over 2017.
The investors have taken a negative view of the housing market. As a result, most homebuilders, home improvement retailers, and lumber producers are trading at 52-week lows.
Consumer debt is at a record high
The US consumer debt is reaching 4 trillion dollars. Consumer debt includes non-mortgage debts such as credit cards, personal loans, auto loans, and student loans. Student loans are equal to $1.5 trillion while auto debt is $1.1 trillion and credit card debt is close to $1.05 trillion. Furthermore, the US housing dent also hit a record high. In June, the combined mortgage and home equity debt were equal to $9.43 trillion, according to the NY Fed. So far, the rising consumer debt has been supported by low delinquencies, higher property values, rising wages, and low unemployment. However, a slowdown in the economy paired with higher interest rates can putt his equilibrium at risk.
High Yield and BBB-rated debt is growing
The size of the US corporate debt market
Bloomberg pointed out that, in 2000, when BBB bonds were only a third of the market, the corporate net leverage (total debt minus cash and short-term investments divided by earnings before interest, taxes, depreciation, and amortization) was 1.7 times. By the end of last year, the ratio had ballooned to 2.9 times.
Further on, the bond powerhouse PIMCO commented: “This suggests a greater tolerance from the credit rating agencies for higher leverage, which in turn warrants extra caution when investing in lower-rated IG names, especially in sectors where earnings are more closely tied to the business cycle.”
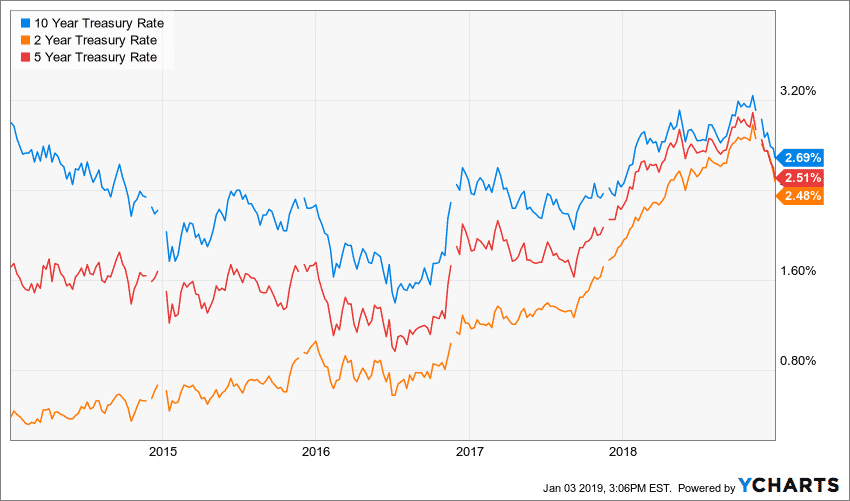
Interest rates
Interest rates were the hot topic of 2018 and will continue to be in 2019. With government debt passing $21 trillion and record high consumer and corporate, it is not a surprise that the market is very jittery to rising interest rates. The Fed hiked its overnight lending rate four times in 2018, to 2.25% – 2.50% level. Subsequently, the 10-year Treasury reached 3.24%, before falling to 2.58% as of January 3rd, 2019. In the meantime, the rates of the 2- and 5-year treasuries started to converge in what is known as inverted yield curve.
2019 Outlook
The US Economy remains strong despite headwinds from multiple directions. Major macroeconomic factors are in
- Highest corporate earnings growth since 2010,
over 25% over the first 3 quarters of 2018 - The last quarter of S&P 500 EPS growth is
expected to be between 12% and 15% - Equity valuations reach fair territory after the
recent selloff. - GDP growth over 3%
- Record high consumer sentiment
- End of year holiday shopping is expected to beat
all records - Record low unemployment
- Highest wage growth since 2008
- Business activity remains high
- Interest rates remain under historical levels
- Low oil prices will temper inflation and lower business
cost
Many economists believe that we are in the last leg of economic expansion. And, some are even predicting a market recession in 2020. However, historically economists and equity have not been an accurate indicator for economic recessions. Realistically speaking it would be very hard to enter an economic downturn from where we are today unless we see a very steep deterioration of government policies and business and consumer spending.
Obviously, at this stage, it is hard to predict the equity markets in 2019. I am looking at three major scenarios, which all have realistic chances of developing.
Scenario 1 (30%)
The bull market continues. The US and China reach a mutually beneficial trade agreement. China commits to relax the rules of US firms conducting business in China and strengthen rules for parent protections. The Fed is more cautious about raising interest rates. Apple’s earnings are not as bad as the market is anticipating. Lower interest rates and oil prices help businesses manage their costs, offset slow down in housing sales and boost consumer spending. The corporate earnings growth beats analyst forecast across the board.
Scenario 2 (20%)
We could see another 10-20% decline in Global Stocks before reaching a bottom. Trump continues to criticize the Fed and interfere in its independence. The government shutdown and political bipartisanship continues without a long-term solution. The Brexit is a disaster. China and the US do not reach a meaningful trade agreement that satisfies the markets. Companies continue to report lower revenue and earnings guidance, and some may start laying off employees.
Scenario 3 (50%)
Global stocks remain volatile for the first 6 months of the year with major swings in both directions. The equity market becomes extremely sensitive to both positive and negative news.
For long-term investors
The best investment strategy has always been buy-and-hold. Trying to time the market is a bad idea. There are many studies that show timing the market has underperformed a buy and hold strategy in the long run. For example, a long-term investor who bought SPY (SPDR S&P 500 ETF) on January 2nd, 2008 would have more than doubled her investment and achieve a 7.2% total return (price appreciations plus dividends).
If you are uncertain about the markets and achieving your financial goals, seek advice from a fiduciary advisor who has your best interest in mind.
About the author:
Stoyan Panayotov, CFA is the founder and CEO of Babylon Wealth Management, a fee-only investment advisory firm based in Walnut Creek, CA. Babylon Wealth Management offers personalized investment management and financial planning services to individuals and families. To learn more visit our Private Client Services page here. Additionally, we offer Outsourced Chief Investment Officer services to professional advisors (RIAs), family offices, endowments, defined benefit plans, and other institutional clients. To find out more visit our OCIO page here.
Disclaimer: Past performance does not guarantee future performance. Nothing in this article should be construed as a solicitation or offer, or recommendation, to buy or sell any security. The content of this article is a sole opinion of the author and Babylon Wealth Management. The opinion and information provided are only valid at the time of publishing this article. Investing in these asset classes may not be appropriate for your investment portfolio. If you decide to invest in any of the instruments discussed in the posting, you have to consider your risk tolerance, investment objectives, asset allocation, and overall financial situation. Different investors have different financial circumstances, and not all recommendations apply to everybody. Seek advice from your investment advisor before proceeding with any investment decisions. Various sources may provide different figures due to variations in methodology and timing,
Contact Us