Tag Investing
9 Smart Tax Saving Strategies for High Net Worth Individuals

The Tax Cuts and Jobs Act (TCJA) voted by Congress in late 2017 introduced significant changes to the way high net worth individuals and families file and pay their taxes. The key changes included the doubling of the standard deduction to $12,000…
Market Outlook April 2018
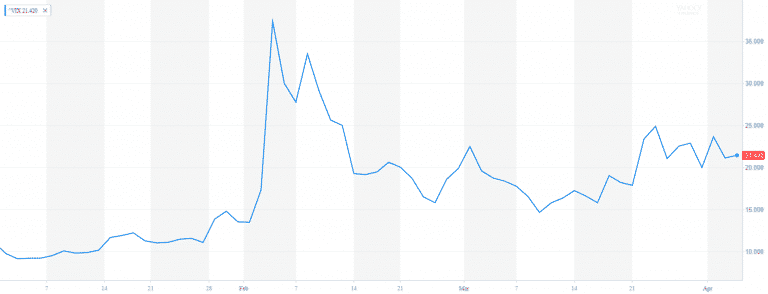
Market Outlook April 2018 After a record high 2017, the volatility has finally returned. Last year the market experienced one of the highest risk-adjusted performances in recent history. In 2017 there were only 10 trading where the S&P 500 moved…
Biggest Risks for the Markets in 2018

Biggest Risks for the Markets in 2018 Wall Street is gearing for another record year on the equity market. On January 2nd Nasdaq crossed 7,000. A day later S&P 500 reached 2,700. Dow Jones followed by passing over 25,000. Who…
Market Outlook December 2017
Market Outlook December 2017 As we approach 2018, it‘s time to reconcile the past 365 days of 2017. We are sending off a very exciting and tempestuous year. The stock market is at an all-time high. Volatility is at a…
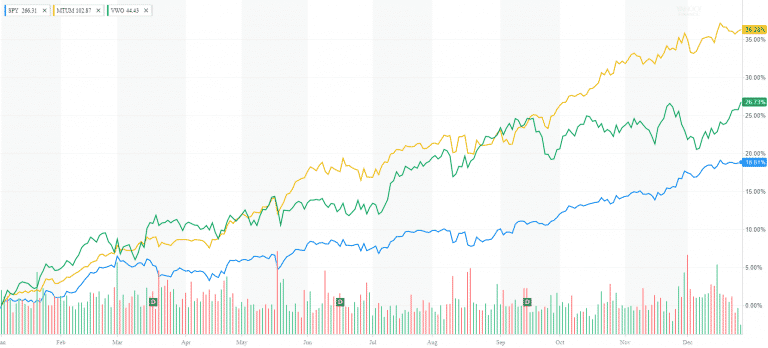
The Rise of Momentum Investing
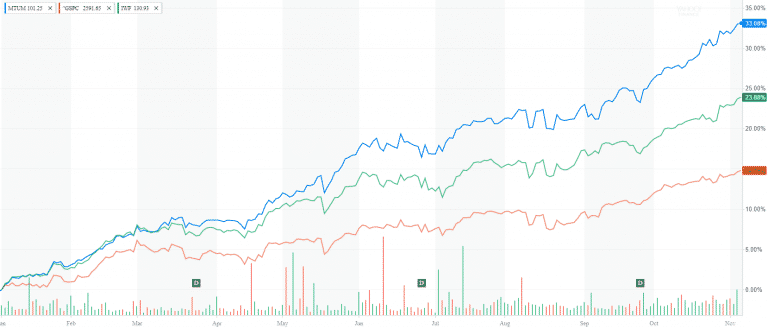
The Rise of Momentum Investing While the momentum theory has been around for two decades, we had to wait until 2017 to see the rise of momentum investing. The largest momentum ETF (MTUM) is up 35% YTD. And unless something…
Will Emerging Markets Continue to Rally
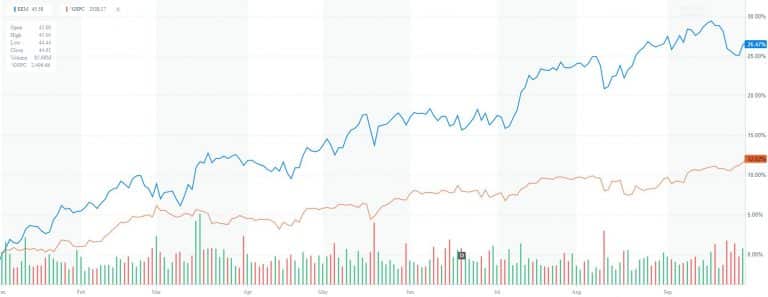
Will Emerging Markets Continue to Rally Emerging Markets are up 26% so far year. But can they sustain the rally? If you invested in one of the large EM ETFs like EEM (iShares MSCI Emerging Markets ETF) or VWO (Vanguard…
6 Saving & Investment Practices All Business Owners Should Follow

In my practice, I often meet with small business owners who have the entire life savings and family fortune tied up to their company. For many of them, their business is the only way out to retirement. With this post,…
End of Summer Market Review
End of Summer Market Review Happy Labor Day! Our hearts are with the people of Texas! I wish them to remain strong and resilient against the catastrophic damages of Hurricane Harvey. As someone who experienced Sandy, I can emphasize with…
5 Myths and One True Fact about passive investing

The passive investing in ETFs and index funds has experienced a massive influx of money in the past ten years. The US ETF market is quickly approaching $3 trillion in assets under management. As of March 29, 2017, the total…
Everything you need to know about your Target Retirement Fund

Target Retirement Funds are a popular investment option in many workplace retirement plans such as 401k, 403b, 457, and TSP. They offer a relatively simple and straightforward way to invest your retirement savings as their investment approach is based on…
Will Small Caps continue to rally under Trump Presidency?
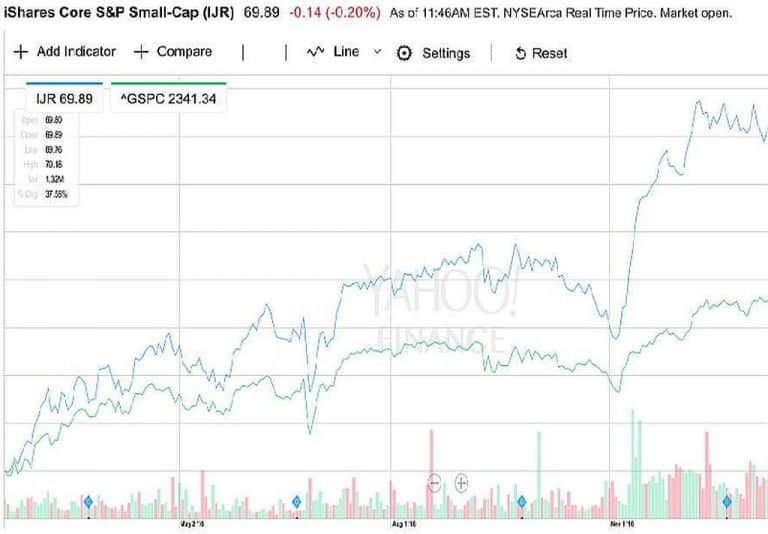
Small Cap stocks are a long-time favorite of many individual investors and portfolio manager. The asset class jumped 38% since the last election. Will Small Caps continue to rally under Trump Presidency? Can they maintain their momentum? The new president Trump…
Municipal Bond Investing

What is a Municipal Bond? Municipal bond investing is a popular income choice for many Americans. The muni bonds are debt securities issued by municipal authorities like States, Counties, Cities, and related businesses. Municipal bonds or “munis” are issued to…
Incentive Stock Options

What is an Incentive Stock Option? Incentive stock options (ISOs) are a type of equity compensation used by companies to reward and retain their employees. ISOs have more favorable tax treatment than non-qualified stock options. While similar to NQSOs, they…
Non-Qualified Stock Options

What are Non-qualified stock options? Non-qualified Stock Options (NSOS) are a popular type of Employee Stock Options (ESO) and a favorite tool by employers to reward and retain workers. NSOs are a contract between the employee and the employer giving…
MLP Investing – Risks and benefits

MLP investing is popular among retirees and income-seeking investors. In this article, we will break down the benefits, risks and tax implications of investing in MLPs. What is an MLP? Managed Limited Partnerships (MLPs) have grown in popularity in the…
Investing in Small Cap Stocks

Small cap stocks are an important part of a diversified investment portfolio. They had provided high historical return and diversification, which are key factors in the portfolio management process. Many flagship companies started as small businesses in a local market…
10 Ways to reduce taxes in your investment portfolio

Successful practices to help you lower taxes in your investment portfolio A taxable investment account is any brokerage or trust account that does not come with tax benefits. Unlike Roth IRA and Tax-Deferred 401k plans, these accounts do not have many…
How to find and choose the best financial advisor near me?

Last update, August 2020……….Seeking a financial advisor near you is a significant step in achieving your personal and financial goals. Financial advisors have been instrumental in helping clients maintain a well-balanced, disciplined, long-term focused approach toward their personal finances and…
Financial planning for physicians

Introduction to Financial planning for physicians Being married to a physician has allowed me to obtain an understanding of the unique challenges of financial planning for physicians. In this post, I will discuss several practices that can help physicians…
4 Steps to determine your target asset allocation

One of the financial advisors’ primary responsibilities is to determine and document their clients’ target asset allocation. The target allocation serves as a starting point and guideline in diversifying the client portfolio and building future wealth. Clients’ unique financial goals,…
Contact Us