Tag Investing
Roth IRA Contribution Limits 2021

The Roth IRA contribution limits for 2021 are $6,000 per person with an additional $1,000 catch-up contribution for people who are 50 or older. Roth IRA income limits for 2021 Roth IRA contribution limits for 2021 are based on your…
Benefits and drawbacks to buying Indexed Universal Life Insurance

Today, I am going off the beaten path for me and will discuss the pros and cons of buying Indexed Universal Life Insurance. As a fee-only advisor, I do not sell any insurance or commission-based products. However, on numerous occasions,…
Investment ideas for 2020

Investment ideas for 2020 and beyond. Learn what trends will drive the stock market in the next decade. Disruption creates opportunity 2020 has been challenging in multiple ways. The global pandemic changed our lives. We have adapted rapidly to a…
Understanding Tail Risk and how to protect your investments

What is Tail Risk? Tail Risk is the possibility of suffering large investment losses due to sudden and unforeseen events. The name tail risk comes from the shape of the bell curve. Under normal circumstances, your most likely investment returns…
IRA Contribution Limits 2020

The IRA contribution limits for 2020 are $6,000 per person with an additional $1,000 catch-up contribution for people who are 50 or older. What is an IRA? IRA or Traditional IRA is a tax-deferred retirement savings account that allows you…
Roth IRA Contribution Limits 2020

The Roth IRA contribution limits for 2020 are $6,000 per person with an additional $1,000 catch-up contribution for people who are 50 or older. Roth IRA income limits for 2020 Roth IRA contribution limits for 2020 are based on your…
Navigating the market turmoil after the Coronavirus outbreak
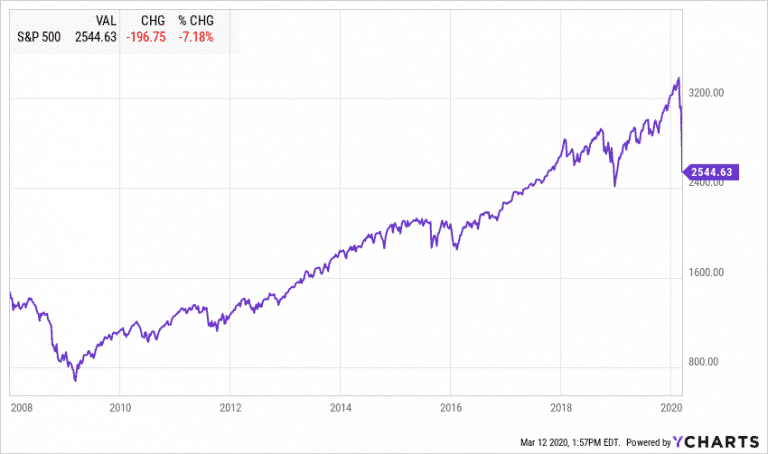
Here is how to navigate the market turmoil after the Coronavirus outbreak, the stock market crash, and bottom low bond yields. The longest bull market in history is officially over. Today the Dow Jones recorded its biggest daily loss since…
Top 5 Dividend Growth ETFs

Dividend growth ETFs offer a convenient and diversified way to invest in companies that consistently grow their dividends. Certainly, dividend-paying stocks provide a predictable stream of cash flows to investors looking for extra income. Companies that steadily grow their dividends year…
The Coronavirus and your money

The Coronavirus and your money. After an unprecedented 10% rally, which started in October of 2019, the stock market is finally hitting a rough patch. The quick spread of the coronavirus in China and around the world made investors nervous…
How to Survive the next Market Downturn

Everything you need to know about surviving the next market downturn: we are in the longest bull market in US history. After more than a decade of record-high stock returns, many investors are wondering if there is another market downturn…
Market Outlook October 2019
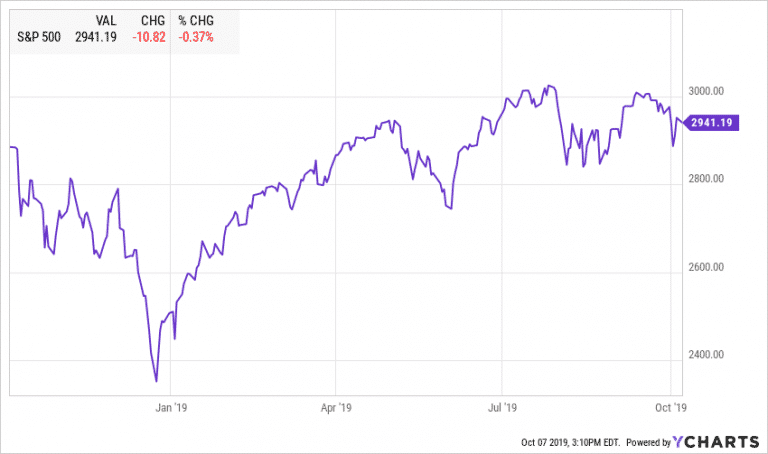
Highlights: Economic Overview Equities US Equities had a volatile summer. Most indices are trading close to or below early July levels and only helped by dividends to reach a positive quarterly return. On July 27, 2019, S&P 500 closed at…
10 Behavioral biases that can ruin your investments

As a financial advisor, I often speak with my clients about behavioral biases. Our emotions can put a heavy load on our investment decisions. In this article, I would like to discuss ten behavioral biases that I encounter every day.…
The biggest risks for your retirement savings

Whether you are just starting your career or about to retire, you need to understand the risks you are facing when you plan for your future retirement. Most experts recommend that you should aim to replace about 80% of work…
Market Outlook July 2019
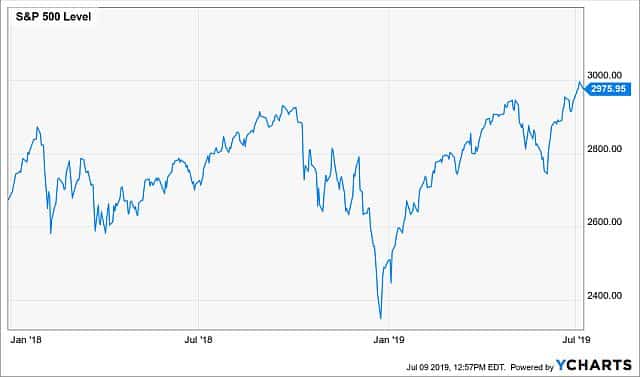
Breaking records So far 2019 has been the year of breaking records. We are officially in the longest economic expansion, which started in June of 2009. After the steep market selloff in December, the major US indices have recovered their…
8 reasons to open a solo 401k plan

Updated for 2024 What is a solo 401k plan? The solo 401k plan is a powerful tool for entrepreneurs to save money for retirement and reduce their current tax bill. These plans are often ignored and overshadowed by the more…
Savings for college with a 529 plan

What is a 529 plan? A 529 plan is a tax-advantaged, state-sponsored investment plan designed to help families save for a beneficiary’s education expenses. Originally focused on college, these plans have evolved significantly, becoming one of the most flexible tools…
All you need to know about Restricted Stock Units (RSUs)

Restricted Stock Units are a popular equity compensation for both start-up and public companies. Employers, especially many startups, use a variety of compensation options to attract and keep top-performing employees. Receiving RSUs allows employees to share in the ownership and…
The December market meltdown explained

S&P 500 is down almost -16% so far in the last quarter of 2018. The market rout which started in October continued with a powerful selloff in December. The technology-heavy NASDAQ is down -20%, while the small-cap Russell 2000 dropped…
The recent market volatility – the tale of the perfect storm
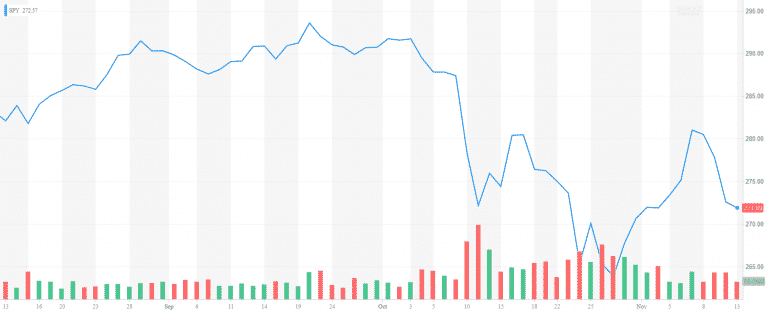
The recent market volatility – the tale of the perfect storm October is traditionally a rough month for stocks. And October 2018 proved it. S&P 500 went down -6.9% in October after gaining as much as 10.37% in the first…
Market Outlook October 2018

Overview The US stock market was on an absolute tear this summer. S&P 500 went up by 7.65% and completed its best 3rd quarter since 2013. Despite the February correction, the US stocks managed to recover from the 10% drop. All…
Contact Us