A bear market bottom is often elusive and hard to identify. Every investor dreams of timing the stock market bottom and consistently buying low and selling high. But in reality, catching the bear market bottom is hard, even for experienced traders.
What is a bear market?
A bear market is a stock market correction of more than 20%. A stock or an index enters a bear market when the price drops by 20% or many from peak to trough. A bear market can be nerve-wracking as the stock market rarely goes down in a straight line. There are dramatic price movements in both directions while the general trend points lower.
What is a bear market bottom?
Bear market bottoms mark the end of the bear market and the start of a new bull market. While everyone wants to catch the exact moment, the bear market bottom is visible mainly in the rearview mirror.
Many investors emphasize a specific date when the stock market reaches an inflection point and bounces back to start a new bull market. However, the bear market bottoming is a process and may take several weeks or months before a meaningful rally occurs.
How to time the bear market bottom?
We generally do not advise trying to time the stock market. It’s a fool’s errand. You must be right twice in your investment process – when to cash out and when to get back in. Even if you time your exit correctly, you may be unable to time the bottom. You need to have a disciplined approach to getting back. You would go against the grain, and you would be buying while most people around you are panic selling.
Even though we don’t recommend it to everyone, timing the bear market bottom can help you invest extra cash sitting on the sideline or rebalance your portfolio.
Here are some signs that can help you recognize the bear market bottom either at present or in hindsight.
Peak negativity
There is no doubt that bear markets are bad news for the economy. 401k balances drop, forcing many people to delay their retirement. Some folks have to sell their investments because they lose their jobs or need extra cash. Media pundits go on TV to tell you that stocks are not a good investment and how far the stock market will go.
Companies lower their earnings expectations and announce hiring freezes and layoffs.
Stocks can lose 20% of their market value in a heartbeat. There is negative news everywhere.
The bear market will hit bottom before all the bad news has faded. Remember, the stock market is a leading indicator. It drops before an economic downturn and goes up ahead of an economic recovery.
Emotional capitulation indicates a bear market bottom
Bear markets can mess up your emotions. They are a true test of your risk tolerance and ability to absorb stock market volatility and losses.
The bear market bottom comes with emotional panic and the desire to sell everything. You may have heard of another term – market capitulation. That marks the time when the last bull has finally given up. Investors lose hope. Some people sell at the very bottom and never come back.
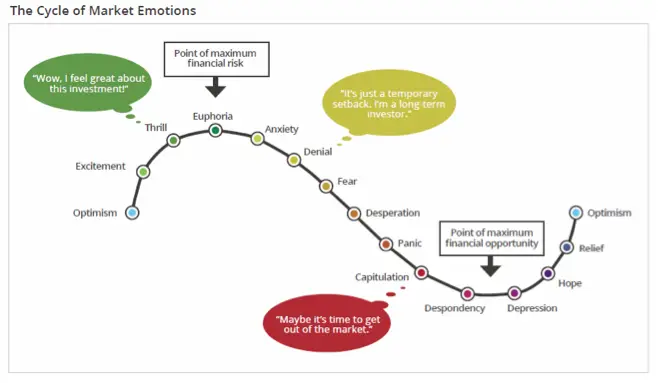
The extreme negative emotions you may experience during a bear market, such as fear or depression, can leave you vulnerable to overstating the long-term risks of your investments. A few times during a bear market, people have asked me if the stock market is going down to zero.
In a bear market, your fears will magnify by the vivid stories of how bad things will get. You will hear a comparison with the Great Depression, the crash of 1987, the Great Financial Crisis, and the Covid meltdown. The strength of feeling could outweigh the power of the evidence. However, any of those events have been a point of maximum financial opportunity for investors.
Taking down the generals
The stock market will bottom only after causing significant pain to a maximum amount of stocks and market participants. The bear market will continue until it steamrolls all the generals and officers, aka the favored market leaders. Some old leaders may never return to the top, and a new cohort will take their place.
Here is the list of the top 10 stocks in the S&P 500 in 2008, just before the financial crisis –
ExxonMobile, Walmart, Microsoft, Procter & Gamble, Johnson & Johnson, AT&T, JP Morgan, General Electric, Chevron, Pfizer.
Here is the list of the top 10 stocks in the S&P 500 as of November 1, 2022 – Apple, Microsoft, Amazon, Tesla, Alphabet, Berkshire Hathaway, United Health, Exxon Mobile, Johnson & Johnson, and JP Morgan
Insider Buying
Corporate executives and insiders receive most of their compensation in company stock and stock options. Their paycheck is a smaller portion of their total comp. The purpose of equity compensation is to align the interest of corporate executives with the shareholders. This system is not always perfect, but it serves its purpose.
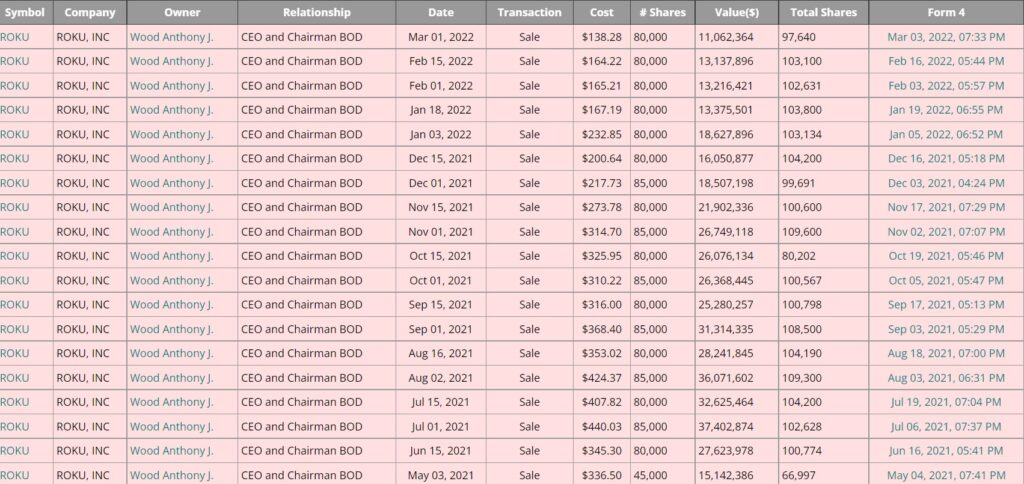
There are many reasons insiders may want to sell their shares – paying off taxes, diversifying, and legacy planning. Many insiders have been notorious for selling at the top of their company stock price.
Take, for example, the CEO of ROKU, Anthony Wood. He has been consistently selling ROKU shares at various price points.
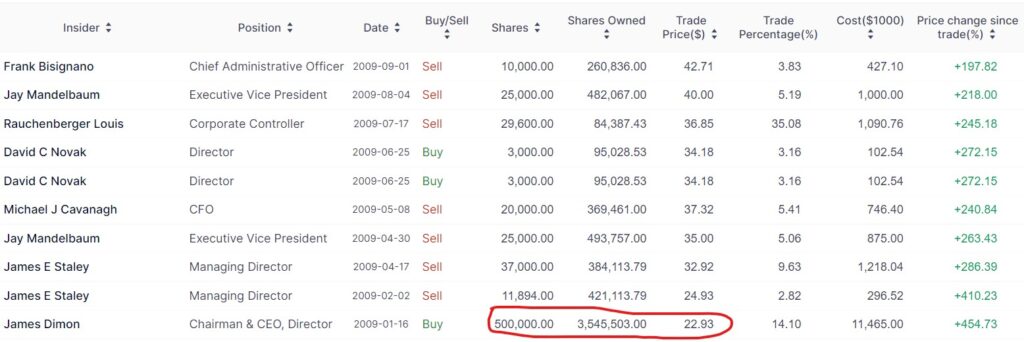
Remember this signature insider buying when Jamie Dimon, the CEO of JP Morgan, bought 500,000 shares of the bank in the middle of the Global Financial Crisis. He made a 450% return on this purchase alone.
Regarding the overall stock market, I want to observe a broader insider buying from executives at various levels from companies across different industries and sectors. Corporate executives and board members have a closer view of their companies’ revenue and earnings projections. Meaningful insider buying activity will give us more confidence in the company’s prospects.
Broader insider buying signals a market bottom or a decisive inflection point. However, It’s essential to analyze insider buying in the context of the current macro environment, specific company news, and price action. Insiders are also human.
Increased M&A activities
During a bear market, many stocks are selling at a discount. Larger companies swoop in and swallow smaller competitors at favorable terms.
M&A activities can happen during all economic conditions. However, the combination of stocks down 20% or 30% and higher acquisition activities can indicate that CEOs feel confident about their companies and the strength of the economy.
Stocks go up on bad news.
Eventually, sellers get exhausted. And there is nobody left to sell. All remaining are long-term investors and true believers.
At that point in time, stocks could start going up even after bad news. Why you may ask. The stock market tends to overshoot both on the upside and the downside. All the bad news eventually gets priced in. So every new piece of bad news might be incrementally better news than the previous. There could be a result of various factors, such as margins remaining stable or earnings not being as bad as feared.
Consecutive UVOL days
Here is one technical indicator that frequently precedes the actual market bottom. And often, it gets missed.
UVOL is the percentage of stocks that go up on any given day. Research has shown that after a significant market decline, 2 or 3 consecutive days of UVOL above 90%, followed by at least 80% positive participation, will signal an inflection point. New buyers are stepping in and finding prices attractive.
For example, during the first three months of 2009, the stock market was down nearly 23% and 53% since January 1, 2008.
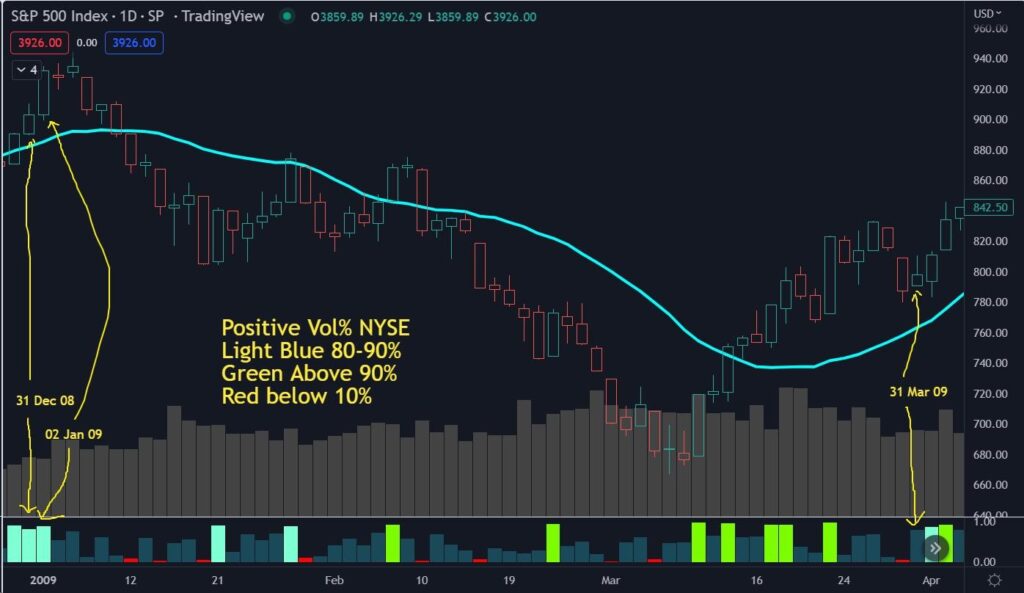
As you can see, despite the market being down, we had multiple days when 90% or 80% of all stock was up on the same day. Ultimately, the S&P 500 hit bottom on March 6 and never looked back.
Fed policies become more accommodative.
The Federal Reserve is one of the leading players causing recession and bear markets. When the Fed wants to stimulate the economy, it lowers interest and increases its balance sheet to improve liquidity and boost overall economic conditions.
On the other hand, when the Fed wants to slow down the economy, they reduce their balance sheet and hike interest rates.
Why would they want to intervene in the market, you may ask? The Fed has a dual mandate – full employment and price stability. If unemployment is too high, the Fed will lower rates to help corporations borrow money at a lower cost of capital and eventually hire more people.
When inflation goes above the Fed target rate, as in 2022, the 1970s, and the early 1980s, the Fed hikes the interest rates to slow down the economy and suppress demand.
Steepening yield curve
In a typical economic climate, long-term bonds and loans carry a higher interest than short-term bonds and loans. The premium compensates the lender for taking a bigger risk and waiting longer to receive their money back.
The spread between short-term and long-term rates is an indicator of the health of the economy. An inverted yield curve had preceded nearly all recessions in US history. This phenomenon occurs when short-term interest rates are higher than long-term interest rates.
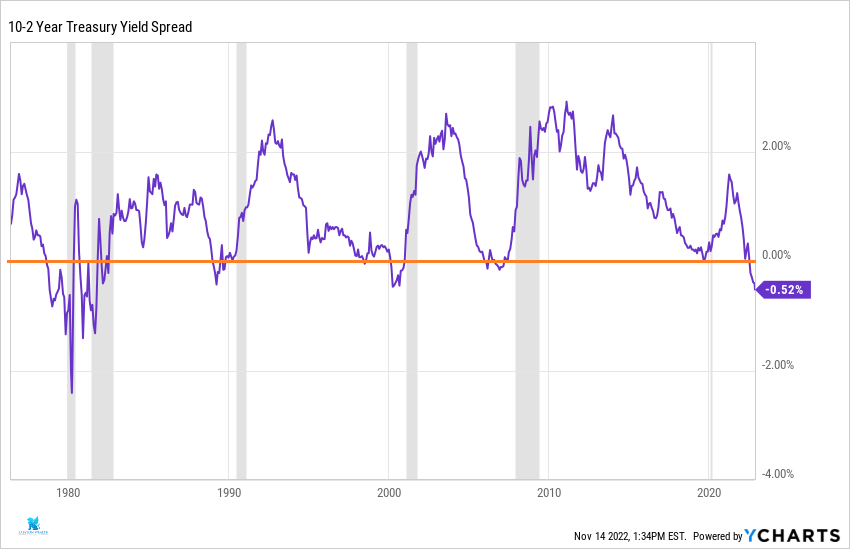
An inverted yield curve is a warning sign that the economy will slow down and possibly fall into recession. Higher short-term rates indicate that structural factors are negatively affecting the economy.
When the Fed lowers short-term rates and the yield curve becomes positively sloped, it is usually a sign that economic conditions are improving and business is returning to usual. The timing of slope change doesn’t always coincide with the exact date of the market bottom. You must consider the impact in the context of the macro environment.
Stocks above 200-day moving averages
Remember, we said in the beginning that bottoming is a process. A stock could take 6 to 12 months or even longer to find its bottom and move up. One measure of price trajectory is the 200-day moving average indicator. As the name suggests, 200 DMA is the average stock price for the last 200 trading days. Taking the series of rolling 200-day moving averages should show the trajectory of the stock price. Stocks in a bear market will have a declining 200-DMA curve and will most likely trade below the 200-day curve for an extended period.
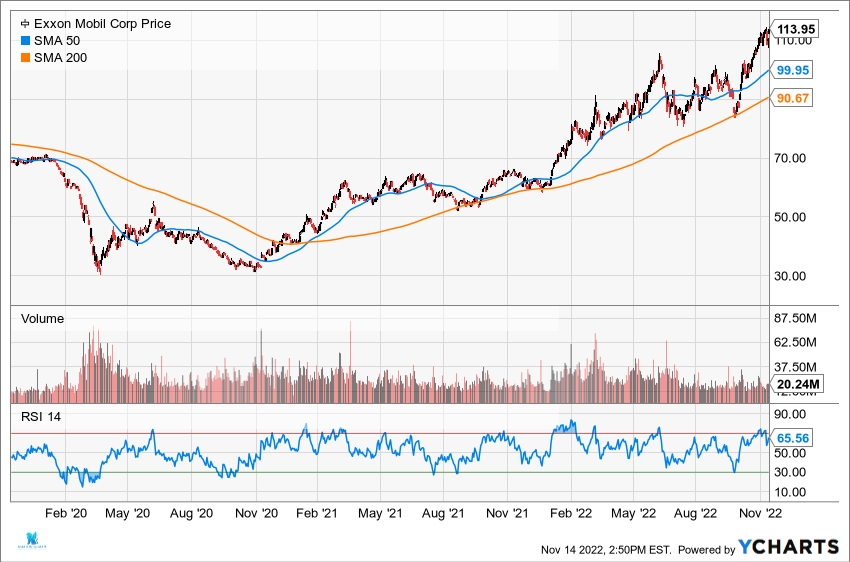
For stocks to complete the bottoming process, they need to shift the direction of the 200 DMA curve from downward to upward. Many traders and investors will wait for the specific stock or index to surpass the 200-day moving average level before buying back.
Stocks in a strong bull market will trade above their 200 DMA curve, serving as a support level.
Bear market bottom and the Fed
The bear markets are volatile. Trying to time the exact bottom is a nearly impossible task. Our emotions will most likely drive us to sell rather than buy at that moment. Also, not every bear market is the same. All these signals that we discussed may not appear at the same time. Some may not appear at all, as every economic cycle is unique.
Investors have relied on the Fed for years to save the stock market from disseminating losses. The Fed doesn’t have the mandate to support the market. But in recent years, they have used the stock market to achieve their mission of full unemployment and low inflation. The Fed will only intervene in saving the market when it supports its agenda.